Comparative Study
. 2005 May 11;25(19):4681-93.
doi: 10.1523/JNEUROSCI.4088-04.2005.

Cortical ensemble adaptation to represent velocity of an artificial actuator controlled by a brain-machine interface

Affiliations
Comparative Study

Cortical ensemble adaptation to represent velocity of an artificial actuator controlled by a brain-machine interface

Mikhail A Lebedev et al. J Neurosci. .

Abstract

Monkeys can learn to directly control the movements of an artificial actuator by using a brain-machine interface (BMI) driven by the activity of a sample of cortical neurons. Eventually, they can do so without moving their limbs. Neuronal adaptations underlying the transition from control of the limb to control of the actuator are poorly understood. Here, we show that rapid modifications in neuronal representation of velocity of the hand and actuator occur in multiple cortical areas during the operation of a BMI. Initially, monkeys controlled the actuator by moving a hand-held pole. During this period, the BMI was trained to predict the actuator velocity. As the monkeys started using their cortical activity to control the actuator, the activity of individual neurons and neuronal populations became less representative of the animal's hand movements while representing the movements of the actuator. As a result of this adaptation, the animals could eventually stop moving their hands yet continue to control the actuator. These results show that, during BMI control, cortical ensembles represent behaviorally significant motor parameters, even if these are not associated with movements of the animal's own limb.


Figures
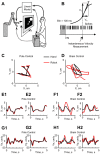
Figure 1.
Figure 1.
Experimental design and modes of operation. A, Experimental apparatus. The monkey was seated in front of a computer monitor on which visual stimuli were shown. It had to pursue a visual target (large circle) with a cursor (small circle). The monkey controlled the cursor by moving a hand-held pole (pole control). The pole actually controlled a robotic arm invisible to the monkey, and the cursor position on the screen reflected the robot's position. A linear model was trained to predict hand/robot velocity from neuronal ensemble activity recorded from the monkey's cortex. Then, the pole was disconnected, and the robot was directly controlled by the model's output (brain control). B, Schematics of movement trajectory, instantaneous velocity, and neuronal discharges preceding or succeeding an IVM. Neuronal rates were estimated using 100 ms bins placed at different lags relative to the IVM. C, Representative traces of the hand (black) and the robot (red) during pole control. D, Hand and robot traces during brain control. E1, E2, Time-dependent traces of the hand and robot position during pole control. F1, F2, Time-dependent position traces during brain control. G1, G2, Hand and robot velocity during pole control. E1, E2, Velocity during brain control.
Figure 2.
Figure 2.
Frequency distributions of velocity (Vx and Vy) for different operations for monkey 1 (A-D) and monkey 2 (E-H). A, E, Pole control, hand velocity. B, F, Brain control with hand movements, hand velocity. C, G, Brain control with hand movements, robot velocity. D, H, Brain control without hand movements, robot velocity.
Figure 3.
Figure 3.
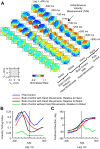
Velocity tuning in M1 neuron tuned during pole control and brain control. A, Color plots of the firing rate of the neuron (color coded; key, bottom left) as a function of Vx and Vy (key, bottom left) for different lags with respect to IVM, different modes of operation (pole control and brain control with and without hand movements), and different velocity parameters (hand or robot movements). B, Velocity tuning index as a function of lag for different types of operation (color coded; key on top). C, Preferred direction as a function of lag (color coded; key on top). deg, Degrees.
Figure 4.
Figure 4.
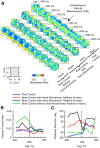
An M1 neuron that was tuned to movement velocity only if the monkey's hand moved. Conventions are as in Figure 3. deg, Degrees.
Figure 5.
Figure 5.
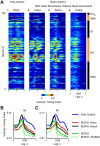
An M1 neuron with enhanced tuning to robot velocity during brain control without hand movements. Conventions are as in Figure 3. deg, Degrees.
Figure 6.
Figure 6.
Changes in velocity tuning for the whole ensemble. A, VTI as a function of lag relative to IVM for the ensemble recorded in monkey 1. Each row corresponds to a neuron. VTI values are shown for pole control (1), brain control with hand movements, relative to hand (2) and to robot (3), and brain control without hand movements, relative to robot (4). ips, Ipsilateral. B, Average VTIs as a function of lag for different conditions (color coded; key on right). Average VTI for shuffled data during brain control without hand movements is shown by the green dotted line. Averages are shown for the whole ensemble. C, Average VTIs as a function of lag for M1 only.
Figure 7.
Figure 7.
Changes in preferred directions for the whole ensemble. A, PD as a function of lag relative to IVM for the ensemble recorded in monkey 1. Each row corresponds to a neuron. PDs are shown for pole control (1), brain control with hand movements, relative to hand (2) and to robot (3), and brain control without hand movements, relative to robot (4). ips, Ipsilateral. B, Correspondence index describing the similarity between PD distribution during pole control and brain control. deg, Degrees.
Figure 8.
Figure 8.
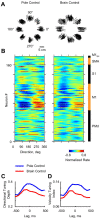
Analysis of neuronal tuning for straight trajectories of the hand. A, Straight trajectories of the hand selected for eight movement directions during pole control and brain control with hand movements. B, Directional tuning curves calculated for the traces above by averaging firing rates for different movement directions within a 300 ms window leading the movement by 100 ms. Each horizontal line represents a curve for a particular neuron. ips, Ipsilateral; deg, degrees. C, Directional tuning depth as a function of lag between the firing rate window and movement trace. D, Velocity tuning index.
Figure 9.
Figure 9.
Off-line predictions of hand velocity under different conditions (key on top). A, Neuron-dropping curves depicting hand prediction quality as a function of neuronal sample size. B, Temporal dynamics of prediction quality for the entire ensemble. C, Prediction quality estimated using a single 100 ms bin placed at different lags with respect to IVM.

References

    1. Alexander GE, Crutcher MD (1990) Neural representations of the target (goal) of visually guided arm movements in three motor areas of the monkey. J Neurophysiol 64: 164-178. - PubMed
    1. Andersen RA, Buneo CA (2002) Intentional maps in posterior parietal cortex. Annu Rev Neurosci 25: 189-220. - PubMed
    1. Ashe J, Georgopoulos AP (1994) Movement parameters and neural activity in motor cortex and area 5. Cereb Cortex 4: 590-600. - PubMed
    1. Averbeck BB, Chafee MV, Crowe DA, Georgopoulos AP (2005) The parietal representation of hand velocity in a copy task. J Neurophysiol 93: 508-518. - PubMed
    1. Baker SN, Spinks R, Jackson A, Lemon RN (2001) Synchronization in monkey motor cortex during a precision grip task. I. Task-dependent modulation in single-unit synchrony. J Neurophysiol 85: 869-885. - PubMed

Publication types