Comparative Study
. 2005 May 11;25(19):4725-32.
doi: 10.1523/JNEUROSCI.0277-05.2005.

Pedunculopontine tegmental nucleus controls conditioned responses of midbrain dopamine neurons in behaving rats

Affiliations
Comparative Study

Pedunculopontine tegmental nucleus controls conditioned responses of midbrain dopamine neurons in behaving rats

Wei-Xing Pan et al. J Neurosci. .

Abstract

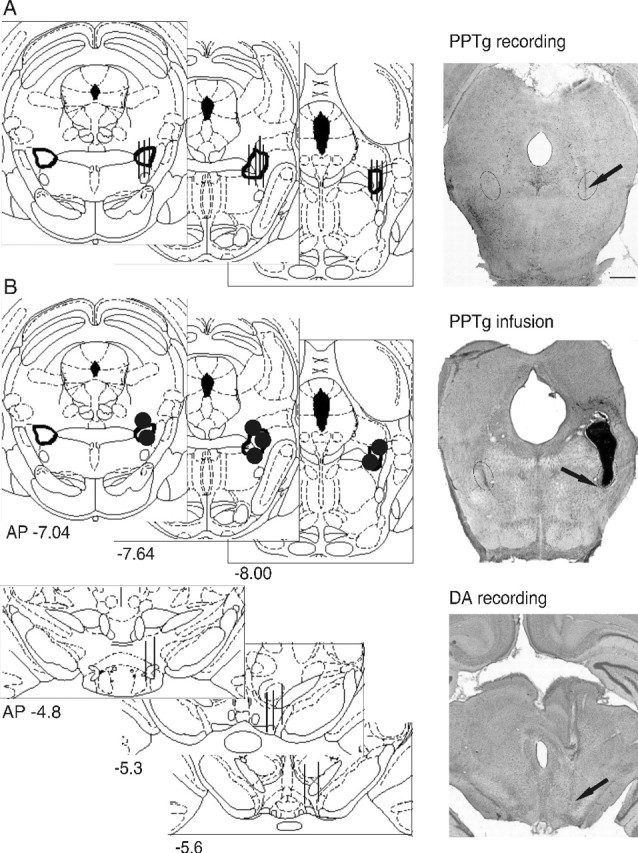
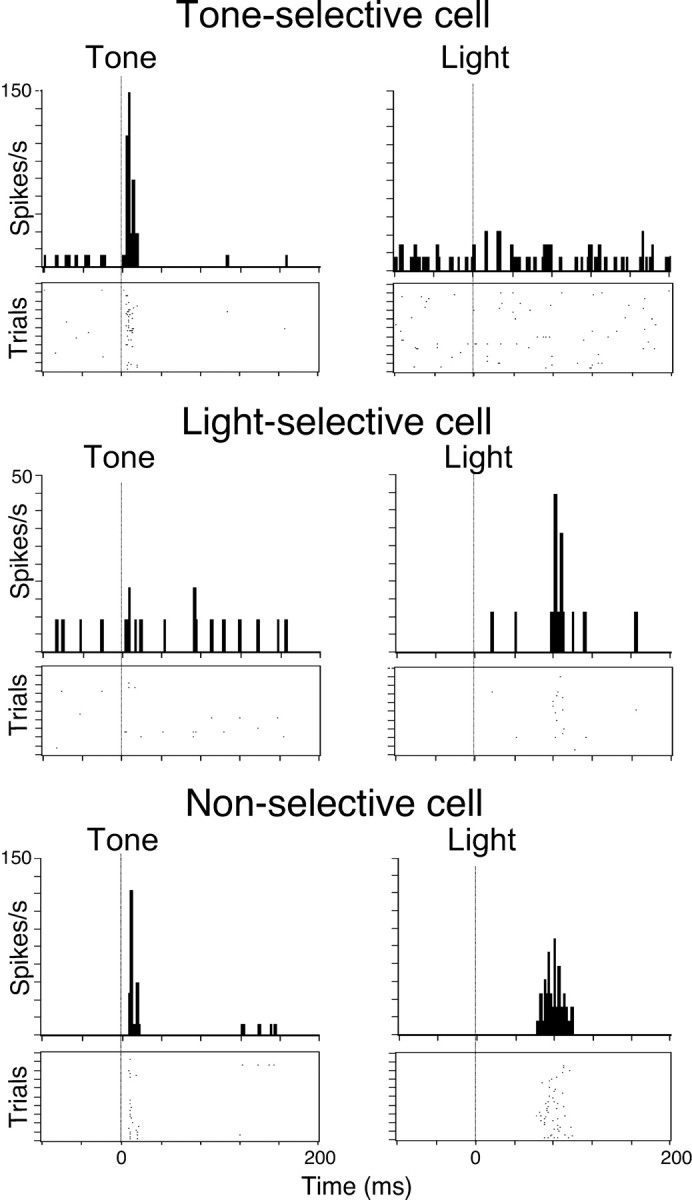
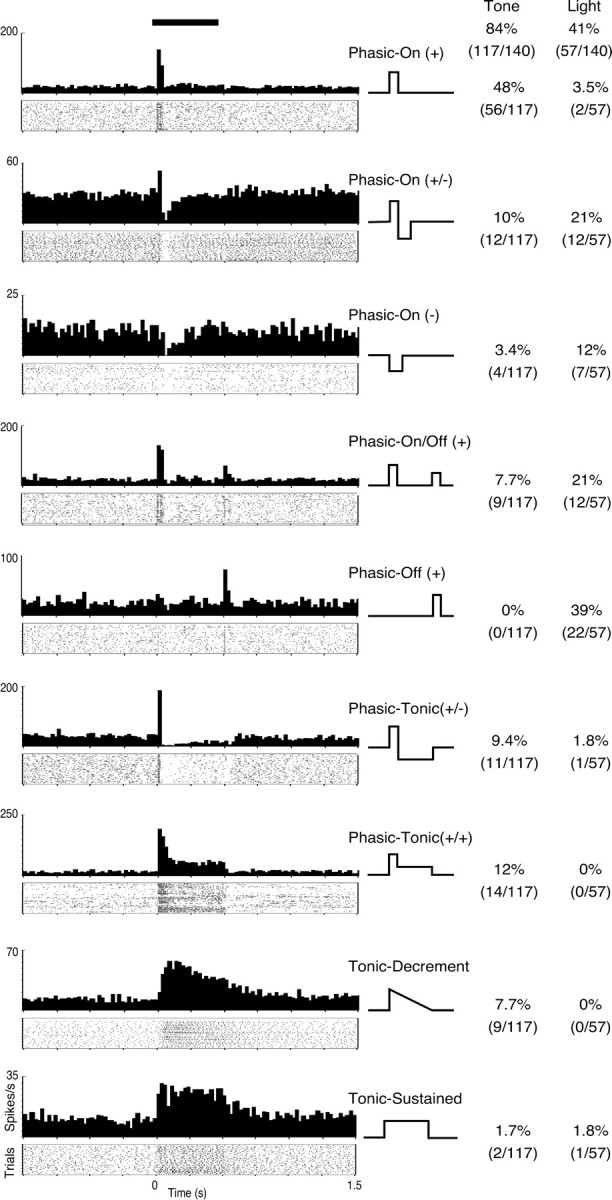
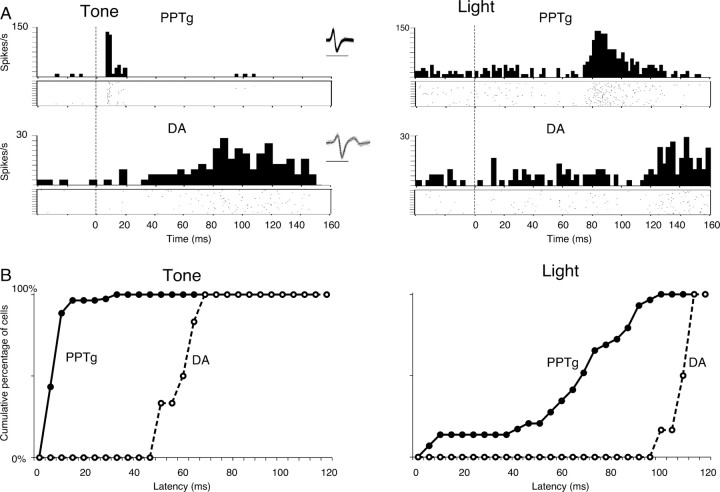
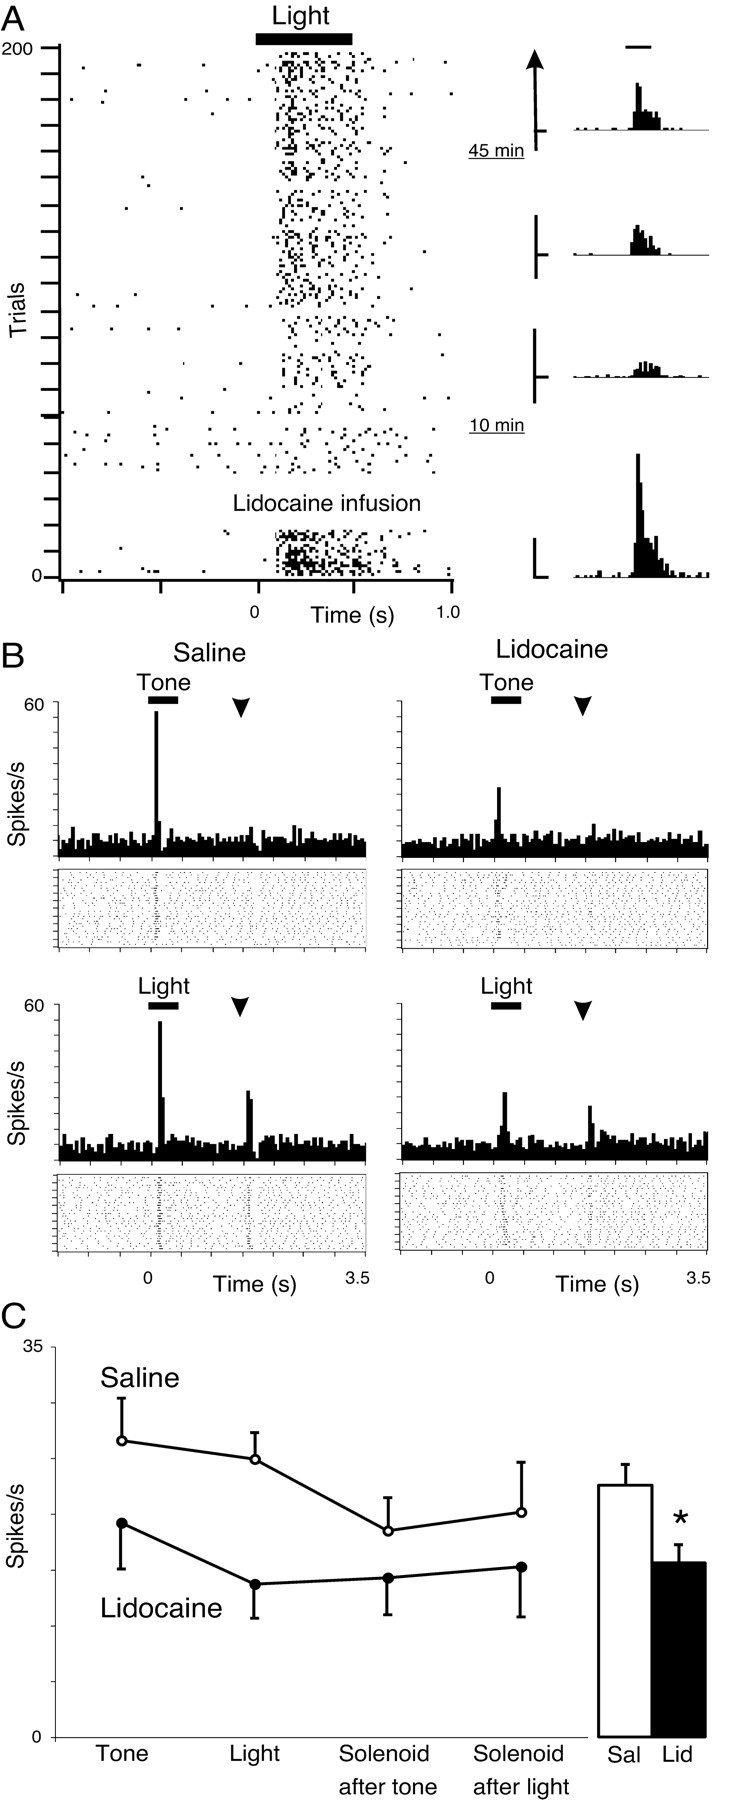
Midbrain dopamine (DA) neurons respond to sensory cues that predict reward. We tested the hypothesis that projections from the pedunculopontine tegmental nucleus (PPTg) are involved in driving this DA cell activity. First, the activity of PPTg and DA neurons was compared in a cued-reward associative learning paradigm. The majority of PPTg neurons showed phasic responses to the onset of sensory cues, at significantly shorter latency than DA cells, consistent with a PPTg-to-DA transmission of information. However, unlike DA cells, PPTg responses were almost entirely independent of whether signals were associated with rewards. Second, DA neuron responses to the cues were recorded in free-moving rats during reversible inactivation of the PPTg by microinfusion of local anesthetic. The results showed clear suppression of conditioned sensory responses of DA neurons after PPTg inactivation that was not seen after saline infusion or in non-DA cells. We propose that the PPTg relays information about the precise timing of attended sensory events, which is integrated with information about reward context by DA neurons.


Figures

Figure 1.
Figure 1.
Location of recording and infusion sites A, PPTg recording experiments. The vertical lines show reconstructed positions of recording-electrode tracks in PPTg mapped on standard atlas sections (Paxinos and Watson, 1997). The boundary of PPTg is indicated by the heavy line on atlas sections. The arrow on the example Nissl-stained histological section indicates the electrode track within the PPTg region (oval). Scale bar, 1 mm (for all sections). B, PPTg inactivation/DA cell recording experiments. Top, The filled circles on atlas sections and the arrow on the example histological section show the position of tips of the infusion cannulas in PPTg. Bottom, The vertical lines on the atlas section and the arrow on the histological section show the position of recording-electrode tracks in VTA/medial SNc. AP, Anteroposterior coordinate (in millimeters) relative to bregma.
Figure 2.
Figure 2.
Example PPTg cell responses to light and tone cues. A, Tone-selective cell. The histogram and dot raster show average firing rate and individual action potentials, respectively, for trials aligned to onset (time 0) of tone stimulus (left PSTH) or light stimulus (right PSTH). The analyses were separated from a single block of cues-only paradigm (no rewards delivered), in which the two stimuli were randomly intermingled. B, A light-selective cell. C, A nonselective cell.
Figure 3.
Figure 3.
Response profiles of PPTg cells to tone and light stimuli. The histograms and dot rasters show average firing rate and individual action potentials, respectively, aligned to stimulus onset for examples of each response type encountered. The black bar shows duration (0.5 s) of stimulus (either tone or light). Responses are classified as being phasic or tonic, occurring at onset (On) or offset (Off) of stimulus, and as excitatory (+) or inhibitory (-). The proportions of cells with each profile are given on the right, separately for tone and light stimuli.
Figure 4.
Figure 4.
Comparison of latency for tone and light responses and between PPTg and DA cells. A, Example responses to tone and light stimuli. The histograms and dot rasters are aligned to stimulus onset (time 0). Insets show overlaid individual waveforms of the recorded cells (calibration: 1 ms). B, Cumulative frequency distributions for PPTg and DA cell response latencies to tone and light.
Figure 5.
Figure 5.
Effect of PPTg inactivation on responses of DA cells. A, Time course of the lidocaine infusion effect. The dot raster shows the response of a DA cell to a light cue (onset at time 0) on individual trials before and after infusion of lidocaine to the PPTg. The trials are arranged in order from bottom to top. The histograms show activity averaged over trials indicated by the vertical bars, before lidocaine infusion (bottom) and for three periods after infusion (full vertical calibration: 70 spikes/s on all histograms). Light-cue duration (0.5 s) is indicated by the horizontal bar above the dot raster and the histograms. This cell did not respond to the tone cue on randomly intermingled tone trials, which are not included in the figure. B, Comparison of lidocaine and saline infusion. Histograms and dot rasters show activity of another DA cell in response to tone (top), light (bottom), and solenoid click (arrowhead; after either tone or light) stimuli. The left panels show postsaline control data, and the right panels show responses of the same cell after lidocaine. The histograms were constructed from the period 5-25 min after infusion. C, Quantitative analysis of the effect of lidocaine infusion to PPTg on DA cell activity. The interaction plot shows mean firing rate in the poststimulus period across all cells for different stimulus types (tone and light cues, solenoid after tone, solenoid after light) separately for saline (open circles) and lidocaine (filled circles) infusion experiments. The bar graph shows the mean poststimulus firing rate for saline (Sal; open bar) and lidocaine (Lid; filled bar) experiments averaged across stimulus type. There was a significant main effect for saline versus lidocaine but no significant effect for stimulus type and no significant interaction. Error bars represent SEM. *p < 0.01.

References

    1. Aebischer P, Schultz W (1984) The activity of pars compacta neurons of the monkey substantia nigra is depressed by apomorphine. Neurosci Lett 50: 25-29. - PubMed
    1. Aghajanian GK, Bunney BS (1977) Dopamine “autoreceptors”: pharmacological characterization by microiontophoretic single cell recording studies. Naunyn Schmiedebergs Arch Pharmacol 297: 1-7. - PubMed
    1. Bechara A, van der Kooy D (1989) The tegmental pedunculopontine nucleus: a brain-stem output of the limbic system critical for the conditioned place preferences produced by morphine and amphetamine. J Neurosci 9: 3400-3409. - PMC - PubMed
    1. Beninato M, Spencer RF (1987) A cholinergic projection to the rat substantia nigra from the pedunculopontine tegmental nucleus. Brain Res 412: 169-174. - PubMed
    1. Bickford PC, Luntz-Leybman V, Freedman R (1993) Auditory sensory gating in the rat hippocampus: modulation by brainstem activity. Brain Res 607: 33-38. - PubMed

Publication types