Comparative Study
. 2005 Jun 1;24(11):1976-87.
doi: 10.1038/sj.emboj.7600679. Epub 2005 May 12.

Oncogenic transcription factor Evi1 regulates hematopoietic stem cell proliferation through GATA-2 expression

Affiliations
Comparative Study

Oncogenic transcription factor Evi1 regulates hematopoietic stem cell proliferation through GATA-2 expression

Hiromi Yuasa et al. EMBO J. .

Abstract

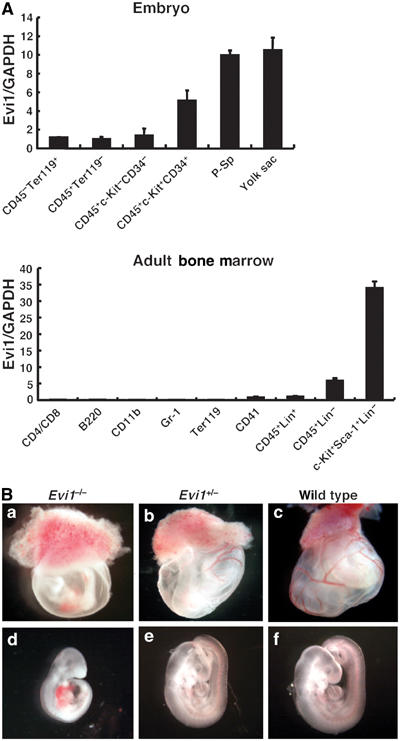
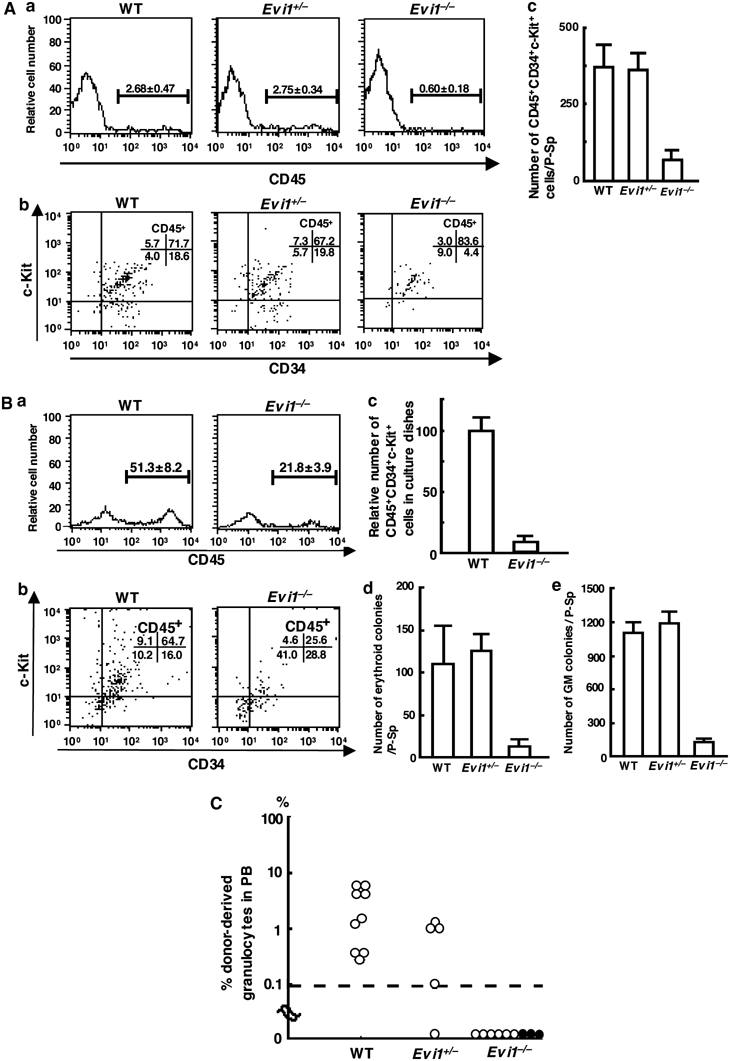
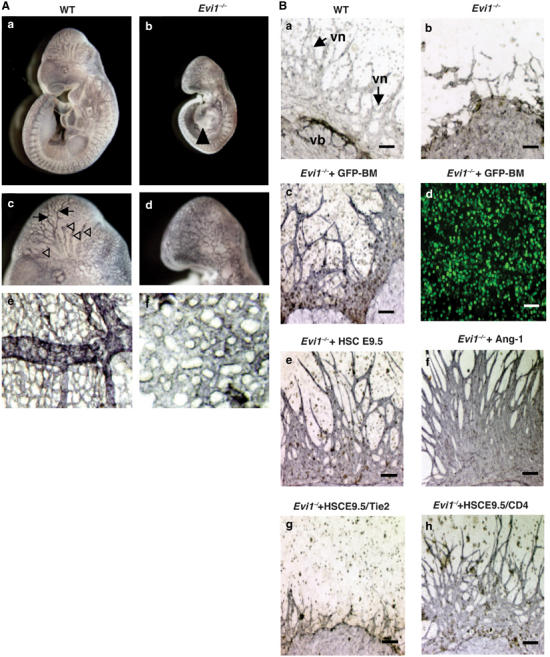
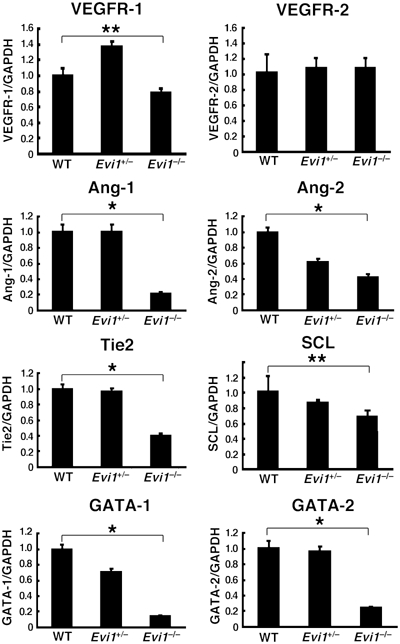
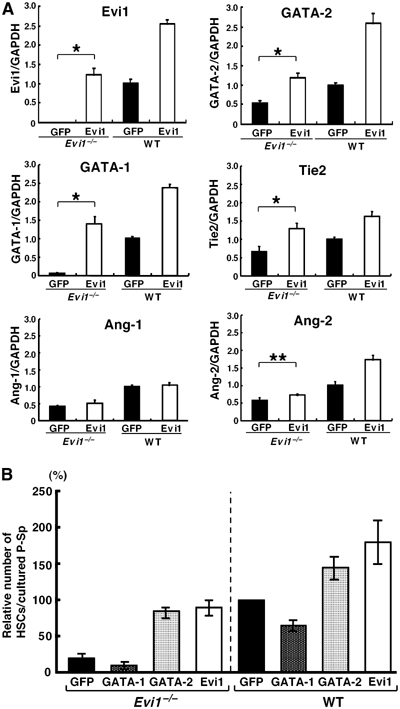
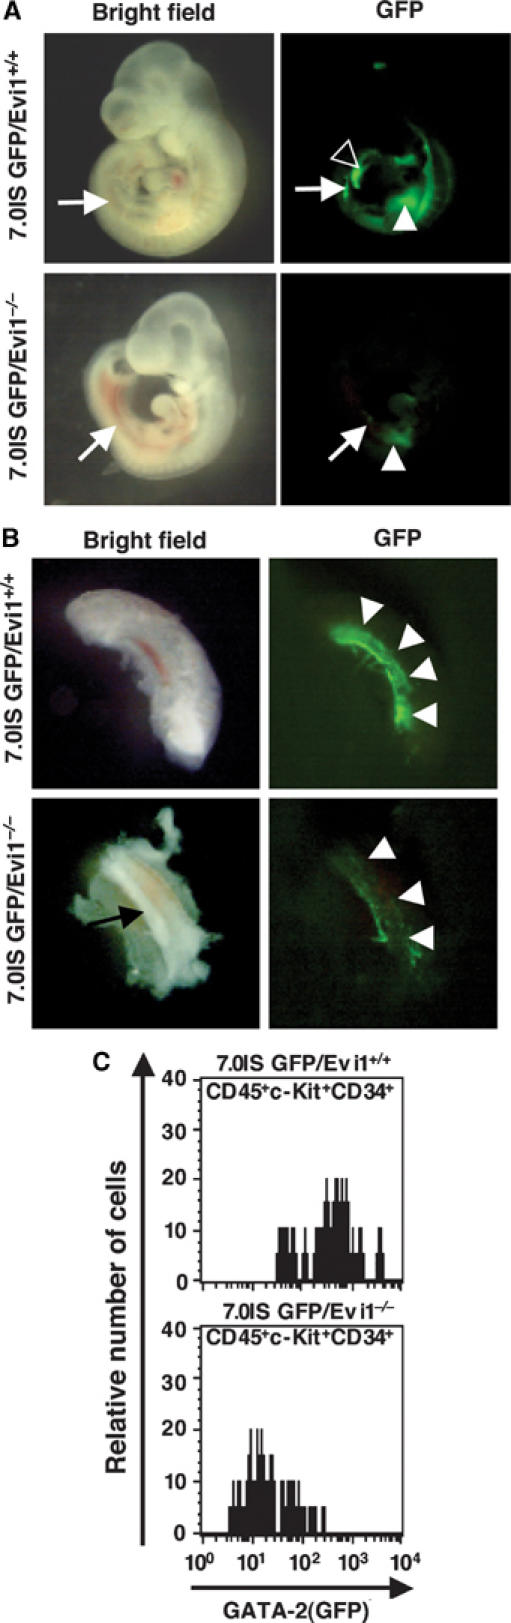
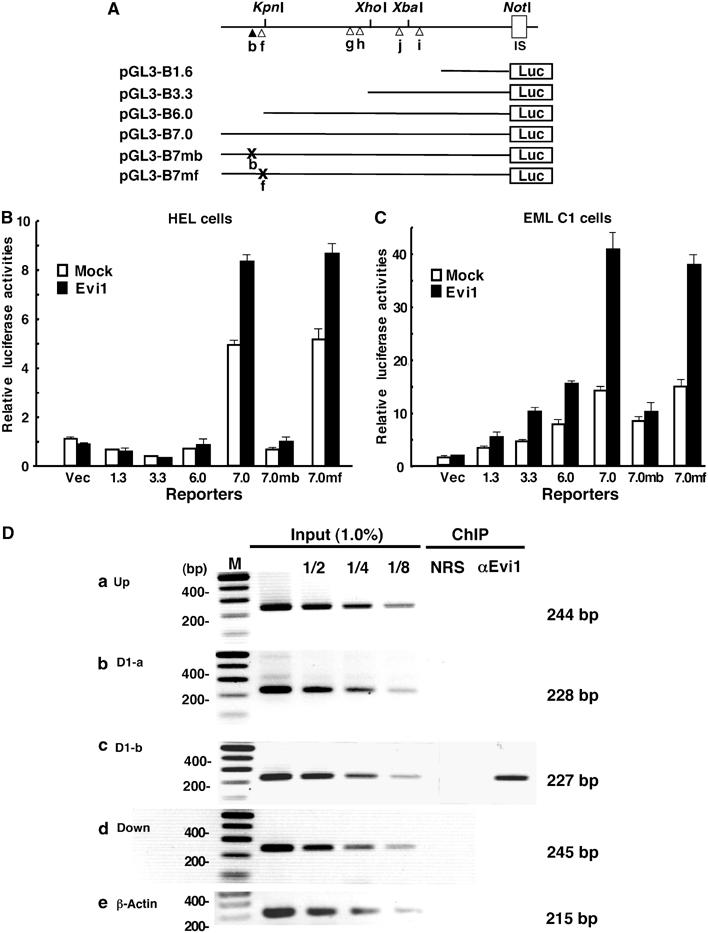
The ecotropic viral integration site-1 (Evi1) is an oncogenic transcription factor in murine and human myeloid leukemia. We herein show that Evi1 is predominantly expressed in hematopoietic stem cells (HSCs) in embryos and adult bone marrows, suggesting a physiological role of Evi1 in HSCs. We therefore investigate the role and authentic target genes of Evi1 in hematopoiesis using Evi1-/- mice, which die at embryonic day 10.5. HSCs in Evi1-/- embryos are markedly decreased in numbers in vivo with defective self-renewing proliferation and repopulating capacity. Notably, expression rate of GATA-2 mRNA, which is essential for proliferation of definitive HSCs, is profoundly reduced in HSCs of Evi1-/- embryos. Restoration of the Evi1 or GATA-2 expression in Evi1-/- HSCs could prevent the failure of in vitro maintenance and proliferation of HSC through upregulation of GATA-2 expression. An analysis of the GATA-2 promoter region revealed that Evi1 directly binds to GATA-2 promoter as an enhancer. Our results reveal that GATA-2 is presumably one of critical targets for Evi1 and that transcription factors regulate the HSC pool hierarchically.


Figures

Figure 1
Figure 1
Expression pattern of Evi1 in hematopoietic cells and gross appearance of E9.5 Evi1−/− embryos. (A) Quantitative RT–PCR analysis of Evi1 mRNA in hematopoietic cells from mouse embryos and adult bone marrow. The embryonic cells analyzed are CD45Ter119+ primitive erythrocytes, CD45+Ter119 hematopoietic cells other than primitive erythrocytes, CD45+c-KitCD34 mature hematopoietic cells, a CD45+c-Kit+CD34+ HSC-enriched population and para-aortic splanchnopleura (P-Sp). The bone marrow cells analyzed are CD4+/CD8+, T cells; B220+, B cells; CD11b+, macrophages and monocytes; Gr-1+, granulocytes; Ter119+, erythrocytes; CD41+, megakaryocytes; CD45+Lin+, mature hematopoietic cells; CD45+Lin, immature hematopoietic cells; c-Kit+Sca-1+Lin, HSC-enriched population. A mixture of anti-Mac-1, -Gr-1, -B220, -CD4, -CD8 and -Ly-6 antibodies was used as a lineage marker (Lin). Evi1 mRNA was assayed by real-time PCR (Materials and methods). The data were normalized to GAPDH mRNA and calibrated to the Evi1/GAPDH ratio (ΔCT) in CD45Ter119+ cells in mouse embryos and CD45+Lin+ in adult bone marrow. The data are the mean and standard deviation of 2ΔΔCt in triplicate assays. (B) (a) The yolk sac from Evi1−/− embryos shows severe anemia and defective large vessel development, while large vessels developed and were organized in the yolk sac of Evi1+/ (b) and wild-type embryos at E9.5 (c). (d–f) Gross appearance of Evi1−/− (d), Evi1+/−(e) and wild-type (d) embryos at E9.5. The Evi1−/− embryo is smaller and much paler than the wild-type littermate, while also showing pericardial effusion and hemorrhaging.
Figure 2
Figure 2
Defects in the in vitro proliferation and differentiation of CD45+c-Kit+CD34+ HSCs from E9.5 Evi1−/− embryos. (A) Incidence of HSCs in E9.5 embryos. The cells from the P-Sp region of E9.5 embryos were stained with anti-CD45, -CD34 and -c-Kit mAbs and analyzed by flow cytometry. (a) CD45+ cells were gated (percentages of CD45+ cells are indicated in the panel). (b) CD45+ cells were examined for the expression of CD34 and c-Kit (percentages of each fraction are indicated in the upper right quadrant). (c) The number of CD45+c-Kit+CD34+ cells in P-Sp from Evi1−/−, Evi1+/− and wild-type embryos at E9.5 was determined. The columns represent the mean values±s.d. (n=5). (B) In vitro hematopoiesis in P-Sp cultures. The cells from the P-Sp cultures on OP9 cells were harvested at 7 days (a–c) and 9 days (d, e) in culture. (a) CD45+ cells that developed in culture were gated (the percentages of CD45+ cells are indicated in the panel). (b) CD45+ cells were examined for the expression of CD34 and c-Kit (the percentages of each fraction are indicated in the upper right quadrant). (c) The numbers of CD45+c-Kit+CD34+ cells in P-Sp culture using Evi1−/− and wild-type P-Sp were determined. The columns represent the mean values±s.d. (n=5). (d, e) The number of progenitor cells that gave rise to erythroid (d) and GM colonies (e) was determined after 7 days of culture. (C) In vivo hematopoietic reconstitution by transplanted cells. One-embryo-equivalent cells from E9.5 P-Sp were injected into a conditioned newborn recipient (open circle). Five-embryo-equivalent cells from Evi1/ P-Sp were transplanted into a recipient mouse (filled circle). At 8–12 weeks after the transplantation, the proportion of the donor-derived cell population in the recipient granulocytes was determined (%).
Figure 3
Figure 3
Defects in vascular remodeling and network formation in E9.5 Evi1−/− embryos. (A) Whole-mount PECAM-1-stained wild-type (a) and Evi1−/− (b) embryos at E9.5. Panels (c) and (d) are high-power views of panels (a) and (b), respectively. The Evi1−/− embryo shows pericardial effusion (arrowhead in (b)). The arrows and arrowheads in (c) indicate the remodeled and organized arteries (arrows) and venous vessels (arrowheads). Highly branched small capillaries and network forming vessels were observed in wild type. Evi1−/− counterparts in (d) show no remodeled and organized arteries or veins, and a smaller caliber change in the vessels. (e, f) Yolk sac vascularization. Highly branched small capillaries were evident in wild type (e), while no remodeled or caliber changed vessel was observed in the yolk sac of Evi1−/− (f). (B) Requirement of HSC development for angiogenesis in vitro. P-Sp explants from Evi1−/− (a) and wild-type (b) embryos were dissected at E9.5 and cultured on OP9 cells. P-Sp cultures were stained with anti-PECAM-1 mAbs. The number of hematopoietic cells (round cells) in Evi1−/− P-Sp cultures (Evi1−/−) (b) was significantly less than that observed in wild-type (WT) cultures (a). Defects in the vascular network (vn) in vitro are evident in Evi1−/− P-Sp cultures (b) in comparison to WT cultures (arrows in (a)). The bar indicates 0.1 mm. (c) Development of vascular network stained with anti-PECAM-1 mAbs in Evi1−/− P-Sp culture with HSCs enriched from GFP-positive adult bone marrow (Evi1−/−+GFP-BM). (d) Detection of GFP-positive cells by fluorescence microscopy in (c). The development of vascular network in Evi1−/− P-Sp culture with HSCs from E9.5 WT embryos (Evi1−/−+HSC E9.5) (e) or with the addition of 200 ng/ml recombinant Ang-1 (Evi1−/−+Ang-1). (f) Recombinant Tie2-Fc fusion protein was added with HSCs from E9.5 WT embryos and inhibited the endothelial cell growth of Evi1/ cells by HSC (Evi1−/−+HSC E9.5/Tie2-Fc). (g) Recombinant CD4-Fc fusion protein was added with HSC and did not inhibit the effect by HSC as a control HSC (Evi1−/−+HSC E9.5/CD4-Fc) (h). The bar indicates 0.1 mm.
Figure 4
Figure 4
Decreased expression of angiopoietin signaling molecules and GATA gene family in the Evi1/ P-Sp region. An analysis of mRNA expression of several genes related to hematopoiesis or angiogenesis in P-Sp from Evi1−/−, Evi1+/− and the wild-type embryos at E9.5 by quantitative RT–PCR. The mRNA expression of each gene was normalized to that of GAPDH mRNA and calibrated to the gene/GAPDH ratio (ΔCT) in wild-type embryos. The relative expression rate in each gene is presented as the mean and standard deviation of 2ΔΔCt in quadruplicate assays. *P<0.001; **P<0.01, relative to controls.
Figure 5
Figure 5
Prevention of defective hematopoiesis in Evi1−/− P-Sp cultures by GATA-2. (A) Evi1 maintains the expression of GATA-2 mRNA in E9.5 Evi1−/− P-Sp. P-Sp explants from both Evi1−/− (Evi1−/−) and wild-type (WT) E9.5 embryos were infected with either an Evi1 retrovirus (Evi1; open square) or a mock EGFP retrovirus (GFP; closed square) as a control. The cells from P-Sp cultures were harvested at 4 days in culture. The mRNA expression of each gene was assayed by quantitative RT–PCR, and then it was normalized to that of GAPDH mRNA and calibrated to the gene/GAPDH ratio (ΔCT) in wild-type P-Sp cells using a control expression vector (EGFP). The relative expression rate in each gene is presented as the mean and standard deviation of 2ΔΔCt in quadruplicate assays. *P<0.001; **P<0.01, relative to controls. (B) P-Sp explants (Evi1−/− or WT) on OP9 cells were infected with GATA-1 (GATA-1), GATA-2 (GATA-2), Evi1 (Evi1) or a mock EGFP (GFP) retrovirus as a control. The columns represent the ratio of the number of CD45+c-Kit+CD34+ cells in P-Sp cultures relative to those in the wild-type P-Sp cultures infected with a mock EGFP retrovirus (100%). Three independent experiments were performed.
Figure 6
Figure 6
Loss of GATA-2 mRNA in P-Sp of E9.5 Evi1−/− embryos. The decreased transcription of GATA-2 in E9.5 Evi1−/− embryos. The expression of the transgene driven by the GATA-2 7.0IS promoter was analyzed in Evi1−/− embryos. 7.0IS-GFP transgenic mice were mated with Evi1+/− mice to create 7.0IS-GFP/Evi1+/− transgenic mice. After the crossing of 7.0IS-GFP/Evi1+/− transgenic mice and Evi1+/− mice, the GFP expression in 7.0IS-GFP/Evi1−/− transgenic mice was compared to that seen in 7.0IS-GFP/Evi1+/− transgenic mice. (A) GATA-2-GFP-positive cells were observed in P-Sp (arrow), liver rudiment (arrow head), the vitelline artery (VA, open arrow) and the dorsal artery (DA) in 7.0IS-GFP/Evi1+/+ transgenic mice (upper panel), while the frequency of GATA-2-GFP-positive cells was markedly decreased in the 7.0IS-GFP/Evi1−/− transgenic mice (lower panels). (B) Higher magnification of lower trunk region, which includes P-Sp of 7.0IS-GFP/Evi1+/+ transgenic mice (upper panel) and 7.0IS-GFP/Evi1−/− transgenic mice (lower panels). The arrowheads indicate the P-Sp region. Few GFP+ cells were detected in the P-Sp of 7.0IS-GFP/Evi1−/− transgenic mice. (C) GFP fluorescence intensity. Histograms of the GFP-positive cells for the CD45+c-Kit+CD34+ cell populations, which are included in P-Sp of 7.0IS-GFP/Evi1+/+ transgenic mice (upper panel) and 7.0IS-GFP/Evi1−/− transgenic mice (lower panels). The data are representative of three independent experiments.
Figure 7
Figure 7
Evi1 directly binds to the promoter region of GATA-2 and thus enhances the GATA-2 transcription. (A) Structure of reporter plasmids of the GATA-2 promoter region. Various lengths (1.6, 3.3, 6.0 and 7.0 kb) of the promoter region and 7.0 kb of the GATA-2 promoter region containing mutations in the binding site (b) (from GACATGGACA to GACATGGAGA) (7mb) or in the binding site (f) (from GATGAG to TATGAG) (7mf) were inserted upstream of the luciferase gene in a promoter-less reporter plasmid (pGL3-Basic). The top line shows six possible binding sites (b, f–h, j and l) and four unique restriction sites (KpnI, XhoI, XbaI and NotI) located upstream of the IS exon. (B) GATA-2 promoter activity and transactivation by exogenous Evi1 in HEL cells. Various GATA-2 IS promoter-LUC reporter constructs (pGL3-B1.6, 3.3, 6.0 and 7.0) were transfected into HEL cells with (black bar) or without (white bar) an Evi1 expression vector. A mock vector (pGL3-B) was used as a control (Vec). (C) GATA-2 promoter activity and transactivation by exogenous Evi1 in EML C1 cells. The experiment was performed as in HEL cells. (D) Specific DNA binding of Evi1 to site b detected by ChIP. Five genomic DNA fragments containing each possible DNA-binding site (D1-a or D1-b) were amplified from the genomic DNA from fixed EML C1 cells after immunoprecipitation with normal rabbit serum (NRS) or with anti-Evi1 antibody (αEvi1). The localization of the amplified regions in GATA-2 promoter is shown in Supplementary Figure 6A. For controls, each genomic region was amplified from purified DNA with the indicated dilutions after formaldehyde fixation and sonication (Input).

Similar articles

Cited by

References

    1. Godin I, Dieterlen-Lievre F, Cumano A (1995) Emergence of multipotent hemopoietic cells in the yolk sac and paraaortic splanchnopleura in mouse embryos, beginning at 8.5 days postcoitus. Proc Natl Acad Sci USA 92: 773–777 - PMC - PubMed
    1. Hoyt PR, Bartholomew C, Davis AJ, Yutzey K, Gamer LW, Potter SS, Ihle JN, Mucenski ML (1997) The Evi1 proto-oncogene is required at midgestation for neural, heart, and paraxial mesenchyme development. Mech Dev 65: 55–70 - PubMed
    1. Iscove NN, Sieber F, Winterhalter KH (1974) Erythroid colony formation in cultures of mouse and human bone marrow: analysis of the requirement for erythropoietin by gel filtration and affinity chromatography on agarose-concanavalin. J Cell Physiol 83: 309–320 - PubMed
    1. Kaneko S, Onodera M, Fujiki Y, Nagasawa T, Nakauchi H (2001) Simplified retroviral vector GCsap with murine stem cell virus long terminal repeat allows high and continued expression of enhanced green fluorescent protein by human hematopoietic progenitors engrafted in nonobese diabetic/severe combined immunodeficient mice. Hum Gene Ther 12: 35–44 - PubMed
    1. Kreider BL, Orkin SH, Ihle JN (1993) Loss of erythropoietin responsiveness in erythroid progenitors due to expression of the Evi1 myeloid-transforming gene. Proc Natl Acad Sci USA 90: 6454–6458 - PMC - PubMed

Publication types

MeSH terms