. 2005 May 18;24(10):1810-20.
doi: 10.1038/sj.emboj.7600667. Epub 2005 May 5.

Deficiency of LKB1 in skeletal muscle prevents AMPK activation and glucose uptake during contraction

Affiliations

Deficiency of LKB1 in skeletal muscle prevents AMPK activation and glucose uptake during contraction

Kei Sakamoto et al. EMBO J. .

Abstract

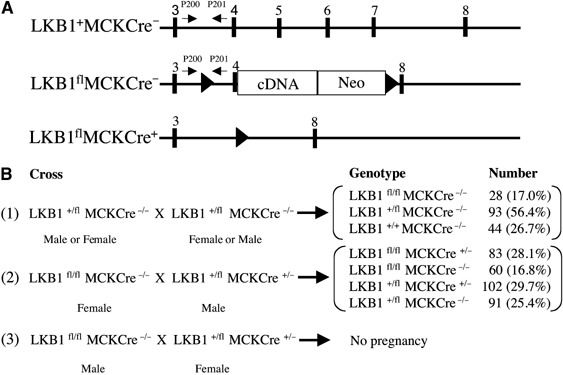
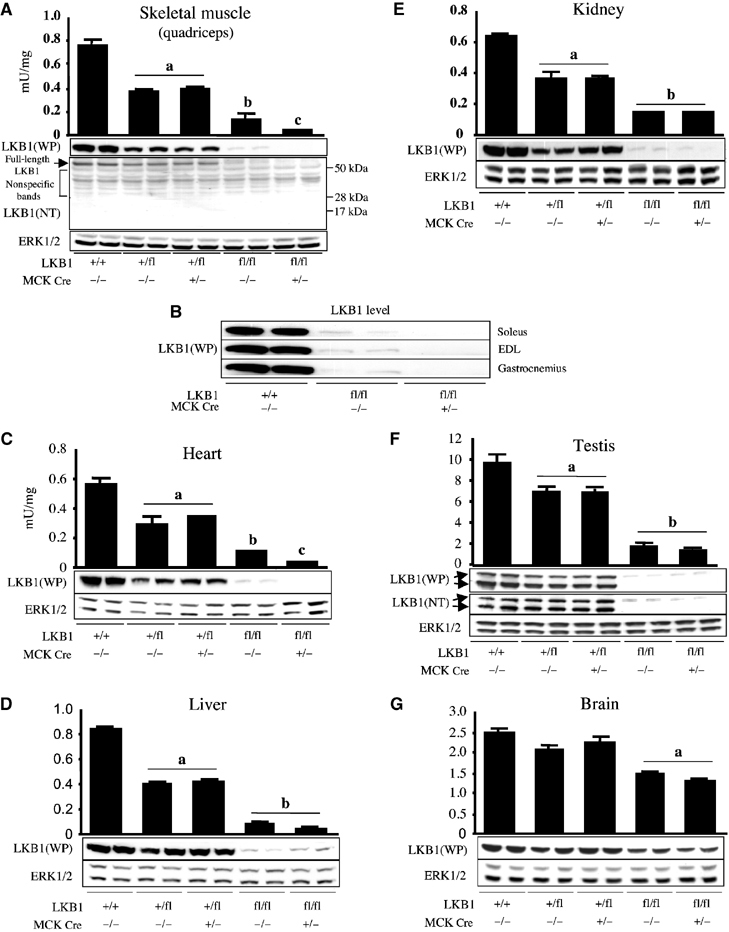
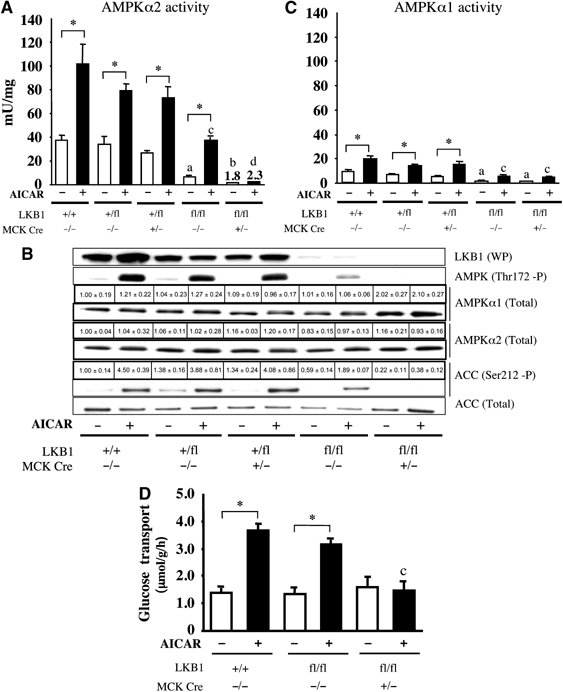
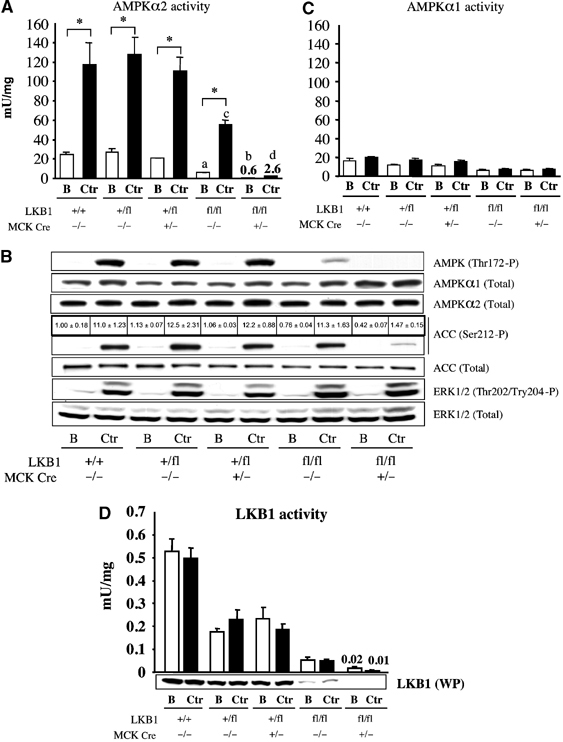
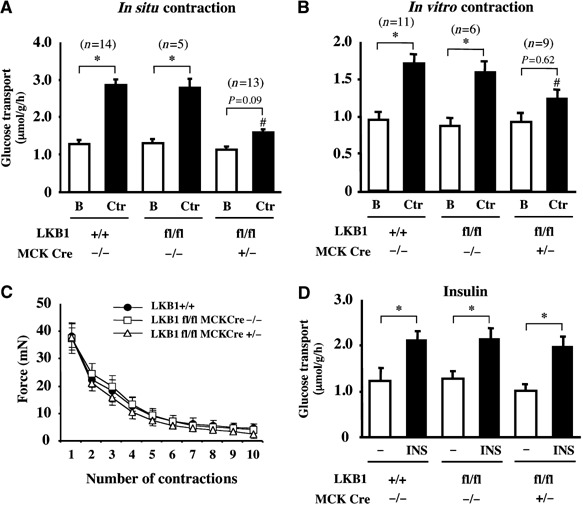
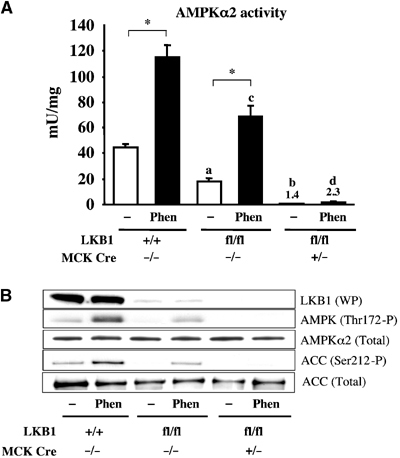
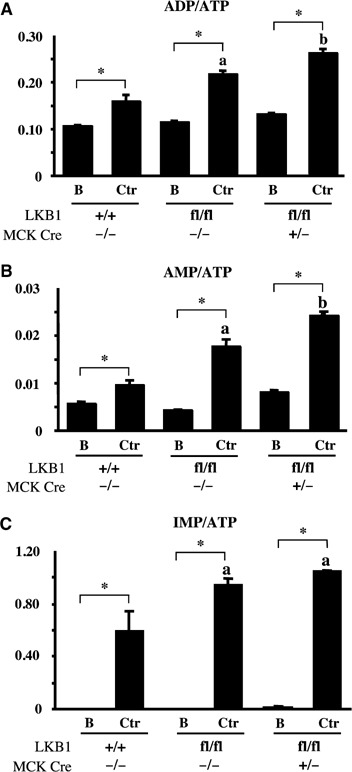
Recent studies indicate that the LKB1 tumour suppressor protein kinase is the major "upstream" activator of the energy sensor AMP-activated protein kinase (AMPK). We have used mice in which LKB1 is expressed at only approximately 10% of the normal levels in muscle and most other tissues, or that lack LKB1 entirely in skeletal muscle. Muscle expressing only 10% of the normal level of LKB1 had significantly reduced phosphorylation and activation of AMPKalpha2. In LKB1-lacking muscle, the basal activity of the AMPKalpha2 isoform was greatly reduced and was not increased by the AMP-mimetic agent, 5-aminoimidazole-4-carboxamide riboside (AICAR), by the antidiabetic drug phenformin, or by muscle contraction. Moreover, phosphorylation of acetyl CoA carboxylase-2, a downstream target of AMPK, was profoundly reduced. Glucose uptake stimulated by AICAR or muscle contraction, but not by insulin, was inhibited in the absence of LKB1. Contraction increased the AMP:ATP ratio to a greater extent in LKB1-deficient muscles than in LKB1-expressing muscles. These studies establish the importance of LKB1 in regulating AMPK activity and cellular energy levels in response to contraction and phenformin.


Figures

Figure 1
Figure 1
Generation of LKB1-deficient mice. (A) Diagram illustrating the positions of exons 3–8 (▪) in the wild-type LKB1+Cre allele. In the LKB1flCre allele, exon 4 of the LKB1 gene is flanked with loxP Cre recombinase excision sites (▴), and exons 5–7 encoding the catalytic domain of LKB1 are replaced with a cDNA construct encoding the remainder of the LKB1 sequence, as well as a neomycin (Neo) selection gene. The expression of the neomycin gene is driven by the LKB1 promoter and it is made as fusion mRNA with LKB1. Its translation is directed by an internal ribosome entry site. In the LKB1flCre+ allele, exons 4–7 of the LKB1 gene are deleted through action of the Cre recombinase, thereby ablating functional expression of LKB1. The positions of the PCR primers used to genotype the mice are indicated with arrows. (B) Breeding strategy employed to generate LKB1fl/fl and LKB1-muscle-deficient (LKB1fl/flCre+/−) mice, where MCKCre denotes transgenic mice expressing the Cre recombinase under the muscle creatine kinase promoter. The number and percentage of each genotype obtained are indicated.
Figure 2
Figure 2
Expression and activity of LKB1 in mouse tissues. (A–G) Extracts of the indicated muscles and other tissues derived from wild-type and mutant mice (7–10 weeks of age) were generated. LKB1 activity was assessed following its immunoprecipitation and assay with the LKBtide peptide. Assays were performed in duplicate from tissues derived from three mice and results presented as the average±s.e.m. The level of LKB1 protein was assessed by immunoblot analysis of 30 μg of protein from tissue extracts using either anti-LKB1 antibody raised against the whole mouse LKB1 protein (WP antibody) or an anti-LKB1 N-terminal antibody raised against the peptide encompassing residues 24–39 of human LKB1 (NT antibody). The ERK1 and ERK2 kinases were immunoblotted as a loading control. The immunoblotting results are representative of independent experiments performed with tissues from two mice. (a) P<0.05 versus LKB1+/+; (b) P<0.05 versus LKB1+/flCre−/−; (c) P<0.05 versus LKB1fl/flCre−/−. Statistical analysis performed using unpaired Student's t test.
Figure 3
Figure 3
Role of LKB1 in regulating AICAR-induced AMPK activation and glucose transport. (A) Isolated mouse EDL muscles derived from wild-type and mutant mice (7–10 weeks of age) were incubated in the presence (+) or absence (−) of 2 mM AICAR for 60 min. AMPKα2 was immunoprecipitated and assayed with the AMARA peptide. Assays were performed in duplicate from tissues derived from 4–5 mice and results are presented as the average±s.e.m. (B) Equal amounts of protein (20–30 μg) from muscle extracts were immunoblotted with the indicated antibodies. The immunoblotting results are representative of independent experiments performed with tissues from at least three mice. Immunoblot analysis of AMPKα1 and AMPKα2 levels as well as ACC phosphorylation was also assessed by quantitative Li-Cor analysis. The data presented are the mean±s.e.m. Expression relative to expression in LKB1+/+ muscle derived from 3–4 mice. (C) As in (A), except that AMPKα1 was immunoprecipitated and assayed. (D) Glucose transport in isolated EDL muscle derived from the indicated mice was determined without (−) or with (+) 2 mM AICAR, as described in Materials and methods. The data are presented as the mean±s.e.m. for muscle isolated from 4–5 mice for each genotype. *P<0.05 basal versus AICAR within each genotype; (a), P<0.05 versus LKB1+/+ (basal); (b) P<0.05 versus LKB1fl/flCre−/− (basal); (c) P<0.05 versus LKB1+/+ (AICAR); (d) P<0.05 versus LKB1fl/flCre−/− (AICAR). Statistical analysis performed using one-way ANOVA and Tukey's post hoc test.
Figure 4
Figure 4
Role of LKB1 in regulating contraction-induced AMPK activation. (A) One leg from anaesthetised mice of the indicated genotype (7–10 weeks of age) was subjected to in situ hindlimb muscle contraction (Ctr, contraction) via sciatic nerve stimulation for 5 min, and the other leg served as noncontracted control (B, basal). Tibialis anterior and EDL muscles from both legs were rapidly extracted and snap frozen in liquid nitrogen. AMPKα2 was immunoprecipitated and assayed with the AMARA peptide. Assays were performed in duplicate from muscles derived from four to five mice and results are presented as the average±s.e.m. (B) Equal amounts of protein (20–30 μg) from the muscle extracts were immunoblotted with the indicated antibodies. Immunoblot analysis of ACC phosphorylation was also assessed by quantitative Li-Cor analysis. The immunoblotting results are representative of independent experiments performed with tissues from at least three mice. (C, D) As in (A), except that AMPKα1 (C) or LKB1 (D) was immunoprecipitated and assayed with AMARA or LKBtide. *P<0.05 basal versus contraction within each genotype; (a) P<0.05 versus LKB1+/+ (basal); (b) P<0.05 versus LKB1fl/flCre−/− (basal) (c) P<0.05 versus LKB1+/+ (ctr); (d) P<0.05 versus LKB1fl/flCre−/− (ctr). Statistical analysis performed using one-way ANOVA and Tukey's post hoc test.
Figure 5
Figure 5
Role of LKB1 in regulating contraction-induced glucose transport. (A) One leg from anaesthetised mice of the indicated genotype (7–10 weeks of age) was subjected to in situ hindlimb muscle contraction (Ctr, contraction) via sciatic nerve stimulation for 5 min, and the other leg served as noncontracted control (B, basal). Following contraction, EDL muscle was isolated and glucose transport measured as described in Materials and methods. (B) Isolated EDL muscles were either subjected to in vitro contraction (Ctr, contraction) via electrical stimulation for 10 min or left unstimulated (B, basal). Glucose transport was then measured as described in Materials and methods. The data in (A) and (B) are presented as the mean±s.e.m. for muscle isolated from the indicated number (n) of mice of each genotype. (C) Force production during contraction protocol. Isolated EDL muscles were subjected to 10 sets of 10-s in vitro contraction and total force generated for each contraction was calculated as described in Supplementary data. The data are presented as the mean±s.e.m. for muscle isolated from three mice for each genotype. (D) Glucose transport activity in isolated EDL muscle from the indicated mice, determined without (−) or with 100 nM insulin (INS) as described in Materials and methods. The data are presented as the mean±s.e.m. for muscle isolated from three mice for each genotype. *P<0.05 basal versus contraction within each genotype; #P<0.05 versus LKB1+/+ (contraction). Statistical analysis performed using one-way ANOVA and Tukey's post hoc test.
Figure 6
Figure 6
Role of LKB1 in regulating phenformin-induced AMPKα2 activation. (A) Isolated mouse EDL muscles derived from wild-type and mutant mice (7–10 weeks of age) were incubated in the presence (Phen) or absence (−) of 2 mM phenformin for 60 min. AMPKα2 was immunoprecipitated and assayed with the AMARA peptide. Assays were performed in duplicate from tissues derived from four mice and results are presented as the average±s.e.m. (B) Equal amounts of protein (20–30 μg) from the muscle extracts were immunoblotted with the indicated antibodies. The immunoblotting results are representative of independent experiments performed with tissues from at least two mice. *P<0.05 basal versus phenformin within each genotype; (a) P<0.05 versus LKB1+/+ (basal); (b) P<0.05 versus LKB1fl/flCre−/− (basal); (c) P<0.05 versus LKB1+/+ (Phen); (d) P<0.05 versus LKB1fl/flCre−/− (Phen). Statistical analysis performed using one-way ANOVA and Tukey's post hoc test.
Figure 7
Figure 7
Measurement of ADP:ATP, AMP:ATP and IMP:ATP ratios in contracting muscle. One leg from anaesthetised mice of the indicated genotype (7–10 weeks of age) was subjected to in situ hindlimb muscle contraction (Ctr, contraction) via sciatic nerve stimulation for 5 min, and the other leg served as noncontracted control (B, basal). Following contraction, tibialis anterior and EDL muscle was isolated and nucleotides extracted and analysed by capillary electrophoresis as described in Supplementary data. The ratios of ADP:ATP (A), AMP:ATP (B) and IMP:ATP (C) derived from analysis of three independent muscle samples for each condition were measured. The results are shown as the average±s.e.m. *P<0.05 basal versus contraction within each genotype; (a) P<0.05 versus LKB1+/+ (basal); (b) P<0.05 versus LKB1fl/flCre−/− (ctr). Statistical analysis performed using one-way ANOVA and Tukey's post hoc test.

References

    1. Altarejos JY, Taniguchi M, Clanachan AS, Lopaschuk GD (2005) Myocardial ischemia differentially regulates LKB1 and an alternate 5′AMP-activated protein kinase kinase. J Biol Chem 280: 183–190 - PubMed
    1. Aschenbach WG, Sakamoto K, Goodyear LJ (2004) 5′ adenosine monophosphate-activated protein kinase, metabolism and exercise. Sports Med 34: 91–103 - PubMed
    1. Baas AF, Boudeau J, Sapkota GP, Smit L, Medema R, Morrice NA, Alessi DR, Clevers HC (2003) Activation of the tumour suppressor kinase LKB1 by the STE20-like pseudokinase STRAD. EMBO J 22: 3062–3072 - PMC - PubMed
    1. Baron SJ, Li J, Russell RR III, Neumann D, Miller EJ, Tuerk R, Wallimann T, Hurley RL, Witters LA, Young LH (2005) Dual mechanisms regulating AMPK kinase action in the ischemic heart. Circ Res 96: 337–345 - PubMed
    1. Boudeau J, Baas AF, Deak M, Morrice NA, Kieloch A, Schutkowski M, Prescott AR, Clevers HC, Alessi DR (2003) MO25alpha/beta interact with STRADalpha/beta enhancing their ability to bind, activate and localize LKB1 in the cytoplasm. EMBO J 22: 5102–5114 - PMC - PubMed

Publication types

MeSH terms

LinkOut - more resources