. 2005 May 18;24(10):1863-73.
doi: 10.1038/sj.emboj.7600654. Epub 2005 May 5.

Impaired maturation of myeloid progenitors in mice lacking novel Polycomb group protein MBT-1

Affiliations

Impaired maturation of myeloid progenitors in mice lacking novel Polycomb group protein MBT-1

Satoko Arai et al. EMBO J. .

Abstract

Polycomb group (PcG) proteins participate in DNA-binding complexes with gene-repressing activity, many of which have been highlighted for their involvement in hematopoiesis. We have identified a putative PcG protein, termed MBT-1, that is associated with Rnf2, an in vivo interactor of PcG proteins. MBT-1 structurally resembles the H-L(3)MBT protein, whose deletion is predicted to be responsible for myeloid hematopoietic malignancies. The human MBT-1 gene is located on chromosome 6q23, a region frequently deleted in leukemia cells, and shows a transient expression spike in response to maturation-inducing stimuli in myeloid leukemia cells. MBT-1(-/-) myeloid progenitor cells exhibit a maturational deficiency but maintain normal proliferative activities. This results in the accumulation of immature myeloid progenitors and hence, a marked decrease of mature myeloid blood cells, causing the MBT-1(-/-) mice to die of anemia during a late embryonic stage. Together, we conclude that MBT-1 specifically regulates the maturational advancement of myeloid progenitor cells during transitions between two developmental stages. We also show that MBT-1 appears to influence myelopoiesis by transiently enhancing p57(KIP2) expression levels.


Figures

Figure 1
Figure 1
Identification of MBT-1. (A) Amino-acid sequence of human and mouse MBT. Bold, conserved amino acids between human and mouse; boxed, NLS; shadowed, the mbt motifs; shadowed and underlined, the SAM/SPM domain. The poly-Q domain in mouse MBT-1 is present between the mbt-3 and the SAM/SPM domains. (B) Nuclear localization of MBT-1. CHO cells were electroporated with pFLAG-MBT-1 and analyzed by confocal microscope after staining for FLAG sequence (Cy3; red signals). Cells were counterstained for Golgi/ER (green signals) by using mAb BIP/GRP78 and FITC-conjugated anti-mouse IgG Ab. Magnification, × 63. (C) Semiquantitative RT–PCR analysis of RNA obtained from fetal liver cells (FLC) of embryos and bone marrow cells (BMC) of adult mice. The amounts of RNA are indicated by arrows. (D) Differential expression of the MBT-1 gene in various stages of progenitors. At least 2 × 10⁴ cells at each stage were sorted and RNA was assessed for expression of MBT-1 and actin by semiquantitative RT–PCR. The amounts of RNA are indicated by arrows. PCR products were separated on an agarose gel, blotted on a membrane and hybridized with 32P-labeled MBT-1 or actin cDNA. (E) Transient induction and diminishment of MBT-1 gene upon maturation. TF-1 cells were stimulated by TPA, and the MBT-1 expression levels were kinetically analyzed by semiquantitative RT–PCR. The amounts of RNA are indicated by arrows. Morphological change of TF-1 cells into macrophage-like cells (cell photos; Giemsa staining; magnification, × 40) due to differentiation started 6 h after stimulation, and was established within 24 h. Three independent experiments were performed, and the representative result is demonstrated. (F) Northern blotting. A 2 μg portion of polyA-RNA isolated from different tissues of adult C57BL/6 mice was separated on 1% agarose gel, blotted on a nylon membrane and hybridized with 32P-labeled mouse MBT-1 full-length cDNA or β-actin cDNA.
Figure 2
Figure 2
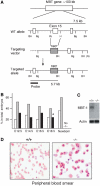
MBT-1−/− mice are embryonic lethal due to anemia. (A) Knockout strategy. Restriction maps are shown for the wild-type MBT-1 gene locus (WT allele), targeting vector and recombinant gene locus (Targeted allele). Exons, white boxes; neor, shadowed box; pBluescript vector sequence, dashed line. Restriction sites: BH, BamHI; Bg, BglII; Xb, XbaI; H, HindIII; (N), NotI from lambda phage sequence. Probe DNA fragment for Southern blotting is indicated, as are the 7.5- and 5.7-kb BamHI hybridized fragments in wild-type and mutant DNA, respectively. (B) Numbers of embryos of +/+ (open boxes), +/− (shadowed boxes) and −/− (filled boxes) represented as percentages of each genotype in embryos collected from three to four timed pregnancies from +/− intercross breeding. *At E18.5, some −/− embryos were lethal. In newborns, no live −/− mice were observed. (C) Northern blotting. Total liver RNA from wild-type (left) or mutant (right) E14.5 embryos was analyzed by Northern blotting for MBT-1 (upper) or actin (lower) expression. A DNA fragment of full-length mouse MBT-1 cDNA was used as a probe. After stripping the MBT-1 probe, 32P-labeled β-actin cDNA was rehybridized on the same membrane. Neither full-length nor shorter variant RNA of MBT-1 was detected in mutant mice. (D) Peripheral blood smears from +/+ or −/− embryos at E16.5 stained by Giemsa solution. In −/−, many nucleated immature erythrocytes were observed. Magnification, × 40.
Figure 3
Figure 3
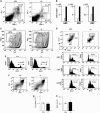
Deficient myelopoiesis in MBT-1−/− embryos. (A) Fewer mature granulocytes and macrophages in MBT-1−/− embryos. E16.5 FLCs from wild-type (+/+) or mutant (−/−) mice were stained by Gr-1 and Mac-1 Abs and analyzed using a FACSCalibure cytometer. Absolute numbers of mature granulocytes (Gr-1+Mac-1+) and macrophages (Gr-1Mac-1+) are presented. (B) FLCs from +/+ and −/− at E17.5 negative for the lineage markers (Lin: CD3, B220, Ter119, DX-5, Gr-1, Mac-3) and IL-7R stained for c-kit, Sca-1, CD34 and FcγR, and analyzed by a FACSCalibure cytometer. Based on the CD34/FcγR profiles of c-kit+Sca-1 cells, absolute numbers for GMP, MEP and CMP were determined. Open boxes, MBT-1+/+; filled boxes, MBT-1−/−. In contrast to the marked reduction of mature myeloid cells, all of their immediate progenitors were increased in mutant mice. Data are representative of 4–5 mice analyzed for each genotype. (C) FLCs from E17.5 wild-type (+/+) or mutant (−/−) embryos stained for Lin, and analyzed by flow cytometry. The relative proportion of the Lin population (gated) is indicated by number. A total of 4–5 mice were analyzed for each genotype and the representative data are presented. (D) BrdU incorporation by CMP, GMP or MEP cells analyzed by flow cytometry. CD34/FcγR profiles and the gated populations are displayed. The BrdU levels in each type of progenitor cells are presented by histograms. Numbers indicate the proportions of BrdU+ cells. Three mice for each genotype were analyzed, and the representative data are shown. (E) Histograms for B220+ cells in E17.5 FLCs and their total numbers. (F) CD4/CD8 profiles and the total numbers of thymocytes from E17.5 embryos. The total numbers represent averages of 4–5 mice analyzed. (G, H) Total number (G) and BrdU incorporation (H) of CLP cells (Linc-kitlowSca-1lowIL-7R+). The total numbers are averages of 3–4 embryos for each genotype analyzed.
Figure 4
Figure 4
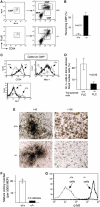
Maturational defect of myeloid progenitor cells in MBT-1−/− mice is cell autonomous. (A–C) In vitro maturation of CMP cells. (A) A total of 5000–10 000 CMP cells sorted from E14.5 +/+ or −/− FLCs were cultured on irradiated OP-9 cells in the presence of SCF, IL-11 and Tpo. After 48 h culture, nonadherent cells were stained for CD34, FcγR, Gr-1 and Mac-1, and analyzed using a FACSCalibure cytometer. CD34/FcγR profiles of sorted CMP cells before the culture (left) and the differentiated stages after the culture (right) are presented. The remaining CMP cells and newly developed GMP cells are gated in the right panels. MEP (CD34lowFcγR) cells are indicated (right panels). (B) Proportions of remaining CMP cells. Data are the means of four independent experiments. The difference between wild-type cells (white box) and mutant cells (black box) was statistically significant (Mann–Whitney test; P<0.01). Error bar: s.e.m. (C) Histograms of CD34, Gr-1 or Mac-1 levels of GMP cells developed from CMP cells. Dashed lines, +/+; solid lines, −/−. (D) B6 (Ly9.1) mice were lethally irradiated (900 rad) and injected with 5 × 10⁵ FLCs (Ly9.1+) isolated from MBT-1+/+ or MBT-1−/− fetal livers (E14.5). At 4 weeks after the transplantation, peripheral blood nuclear cells (PBC) were analyzed for Ly9.1+-donor-derived Gr-1+ cells. Proportions of Gr-1+ cells are presented. Data are the means of five recipients for each type of FLCs. The difference was statistically significant (Mann–Whitney test; P<0.05). Error bar: s.e.m. (E–G) Deficient maturation of MBT-1−/− MEP cells into mature erythrocytes. After 12 days culture in methylcellulose, MBT-1+/+ MEP cells gave rise to many colonies containing clusters of mature erythrocytes (E, upper panels) in which the cells were c-kitnegative or low (G, dashed line in the histogram), while MBT-1−/− MEP cells remained at an immature stage forming colonies consisting of c-kithigh+ (G, solid line in the histogram), large round cells (E; lower panels). Magnifications, × 40, × 100. (F) The number of mature colonies (means of three experiments) derived from MBT-1+/+ MEP cells (open box) and MBT-1−/− MEP cells (filled box). Error bar, s.e.m. Magnifications, × 40, × 100.
Figure 5
Figure 5
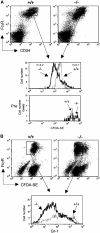
Increased numbers of cell divisions in MBT-1−/− progenitor cells during maturation between the CMP and GMP stages. (A) Upper: After 48 h culture, GMP cells exhibiting the same CD34/FcγR levels were gated and their CFDA-SE intensities are presented as histograms. Lower (indicated as Pre): CFDA-SE levels of sorted CMP cells before the culture are displayed. Dashed lines, +/+ cells; solid lines, −/− cells. Numbers of cell divisions undergone during the culture period (n) are indicated in the upper panels. (B) GMP cells harboring the same CFDA-SE intensity were gated, and their Gr-1 expression levels are displayed as histograms. Dashed lines, +/+ cells; solid lines, −/− cells.
Figure 6
Figure 6
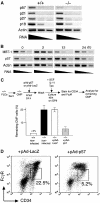
Decreased p57KIP2 expression in MBT-1−/− FLCs. (A) Semiquantitative RT–PCR analysis of RNA obtained from wild-type (+/+) and mutant (−/−) FLCs (E14.5) for p57KIP2, p21WAF1/CIP1 , p27KIP1, p18INK4c (presented as p57, p21, p27, p18, respectively) and β-actin. The amounts of RNA are indicated by arrows. (B) Kinetics of p57KIP2 expression induction in response to TPA in TF-1 cells. TF-1 cells were stimulated by TPA, and the p57KIP2 and MBT-1 expression levels were kinetically analyzed (0, 2, 12 and 24 h after stimulation) by semiquantitative RT–PCR. (C) CMP cells sorted from FLCs of E14.5 MBT-1−/− embryos, and infected either with pAd-p57 or pAd-LacZ (encoding p57KIP2 or LacZ, respectively). After the infection, cells were cultured in vitro for 48 h as described in Figure 4 legend. Thereafter, the cells were restained with CD34 and FcγR. The proportions of remaining CMP cells are presented. In wild-type cells, almost no CMP cells remained after 48 h. In noninfected mutant cells, a significant proportion of CMP cells were detected. pAd-LacZ-infected mutant cells showed an equivalent proportion of remaining CMP cells to that of noninfected mutant cells, while pAd-p57-infected mutant cells (shadowed box) showed a remarkable reduction in the remaining CMP cell proportion. (D) CD34/FcγR profiles of post-48-h-culture MBT-1−/− cells infected with pAd-p57 (right) or the control pAd-LacZ (left). The proportions of remaining CMP cells are indicated by numbers.
Figure 7
Figure 7
MBT-1 associates with Rnf2. (A) MBT-1 associates with Rnf2 in yeast cells. A full-length MBT-1 cDNA fragment was subcloned into the pGBKT7 yeast expression vector, which results in expression of a fusion protein of MBT-1 and GAL4 DNA-binding domain. On the other hand, the full-length Rnf2 cDNA fragment was cloned into the pGADT7 vector to produce a fusion protein of Rnf2 and GAL4-activating domain. Resulting plasmids were transformed into the yeast cell line AH109 harboring the reporter genes for ADE2, HIS3 and MEL1 that are under the regulation of GAL4 upstream activating sequences (UASs). The pGBKT7-containing AH109 cells can grow in the absence of tryptophan (Trp), while the pGADT7 allows AH109 cells to survive without leucine (Leu). When MBT-1 and Rnf2 associate in AH109 cells, the three reporter genes are expressed, thus allowing the cells to grow on a selective media plate lacking histidine (His) and adenine (Ade), as well as to express α-galactosidase activity. AH109 cells were transformed with (a) pGBKT7-MBT-1 and pGADT7-Rnf2, or (b) pGBKT7-MBT-1 and pGADT7-vector (without the Rnf2 sequence). Both transformants survived on a −Leu/−Trp media plate (left), but only (a) grew and revealed α-galactosidase activity on a −Leu/−Trp/−His/−Ade/X-α-gal media plate (right). (B) Co-immunoprecipitation. Both or either of FLAG-tagged MBT-1 and V5-tagged Rnf2 were expressed in 293T human kidney cells. Cell lysates were immunoprecipitated by using either anti-FLAG or anti-V5 antibody conjugated with agarose beads. Precipitants were separated by SDS–PAGE, blotted on a membrane and specific signals were detected by Western blotting. IP: immunoprecipitation; WB: Western blotting.

Similar articles

Cited by

References

    1. Akasaka T, Tsuji K, Kawahira H, Kanno M, Harigaya K, Hu L, Ebihara Y, Nakahata T, Tetsu O, Taniguchi M, Koseki H (1997) The role of mel-18, a mammalian Polycomb group gene, during IL-7-dependent proliferation of lymphocyte precursors. Immunity 7: 135–146 - PubMed
    1. Akashi K, Reya T, Dalma-Weiszhausz D, Weissman IL (2000a) Lymphoid precursors. Curr Opin Immunol 12: 144–150 - PubMed
    1. Akashi K, Traver D, Miyamoto T, Weissman IL (2000b) A clonogenic common myeloid progenitor that gives rise to all myeloid lineages. Nature 404: 193–197 - PubMed
    1. Alkema MJ, Jacobs H, van Lohuizen M, Berns A (1997) Pertubation of B and T cell development and predisposition to lymphomagenesis in Emu Bmi1 transgenic mice require the Bmi1 RING finger. Oncogene 15: 899–910 - PubMed
    1. Barreda DR, Belosevic M (2001) Transcriptional regulation of hemopoiesis. Dev Comp Immunol 25: 763–789 - PubMed

Publication types

MeSH terms