Comparative Study
. 2005 Aug 1;566(Pt 3):689-715.
doi: 10.1113/jphysiol.2005.086835. Epub 2005 May 12.

Kv7/KCNQ/M and HCN/h, but not KCa2/SK channels, contribute to the somatic medium after-hyperpolarization and excitability control in CA1 hippocampal pyramidal cells

Affiliations
Comparative Study

Kv7/KCNQ/M and HCN/h, but not KCa2/SK channels, contribute to the somatic medium after-hyperpolarization and excitability control in CA1 hippocampal pyramidal cells

Ning Gu et al. J Physiol. .

Abstract

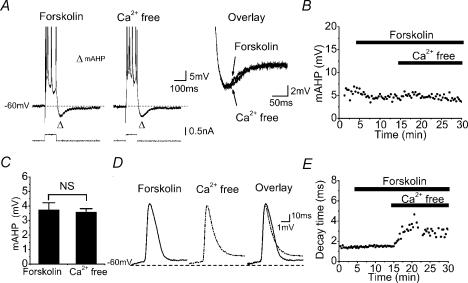
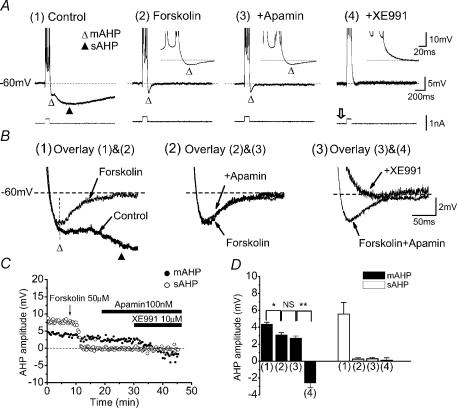
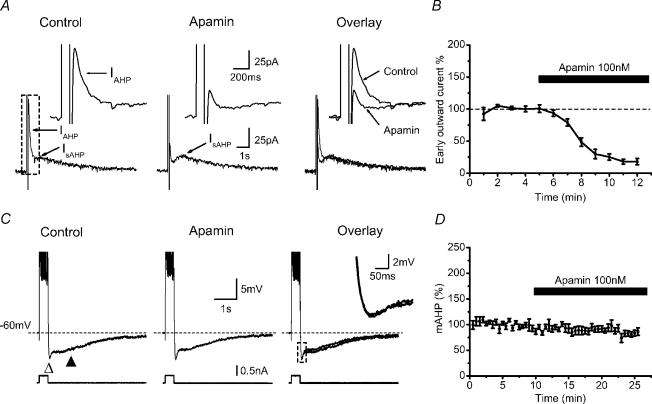
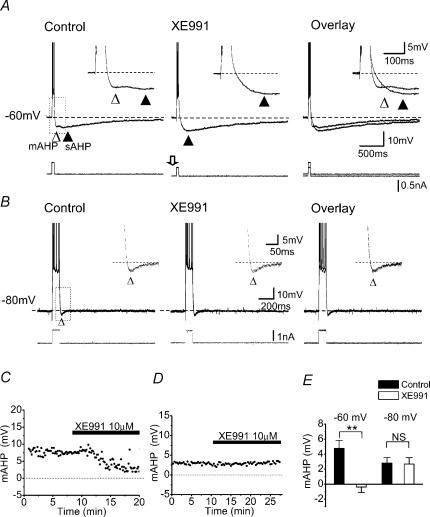
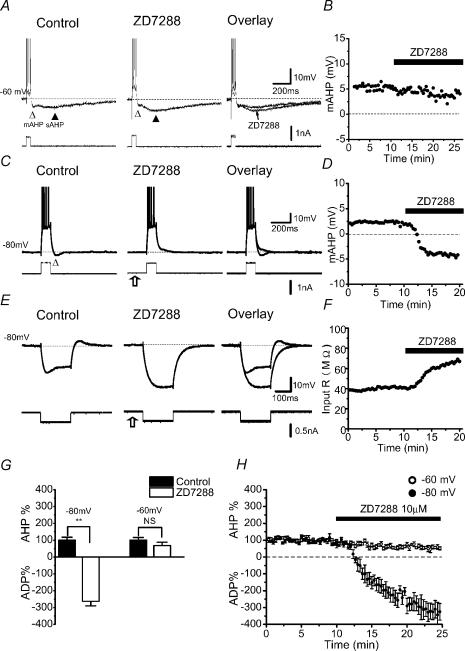
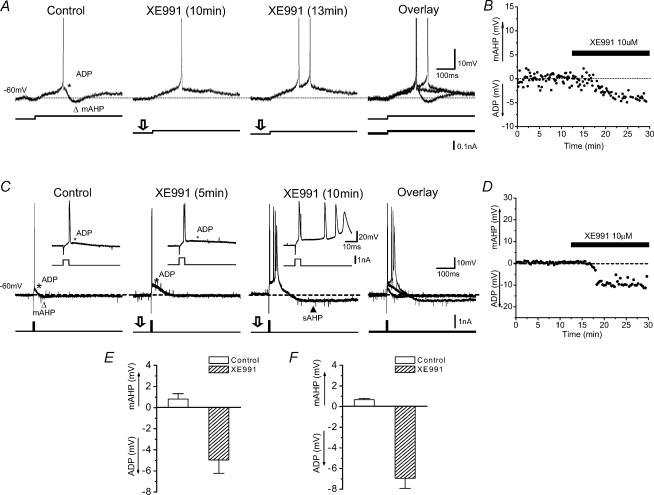
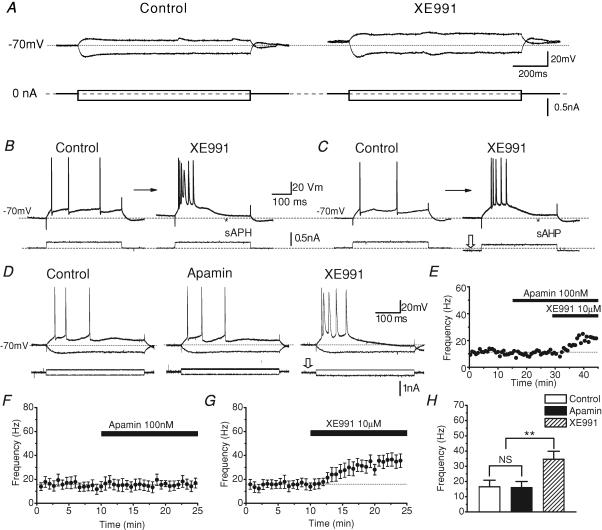
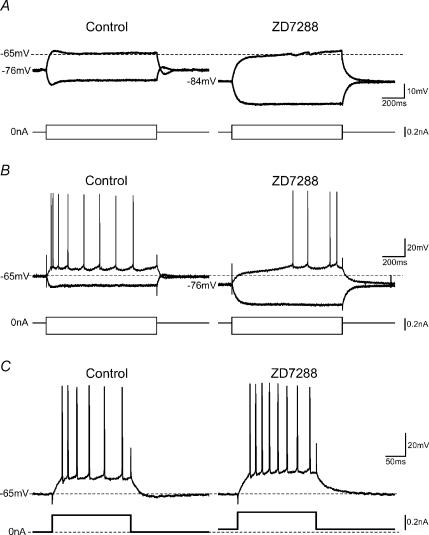
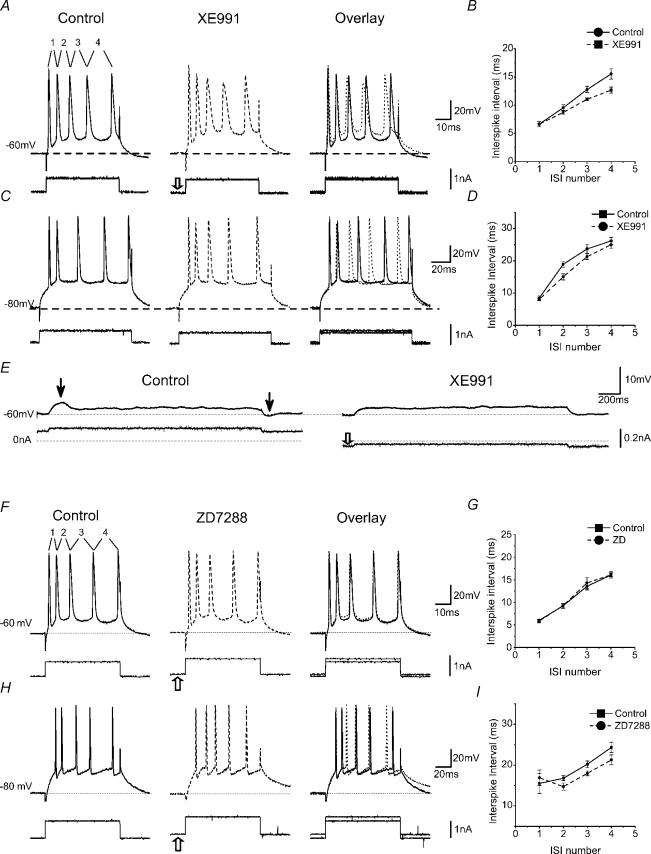
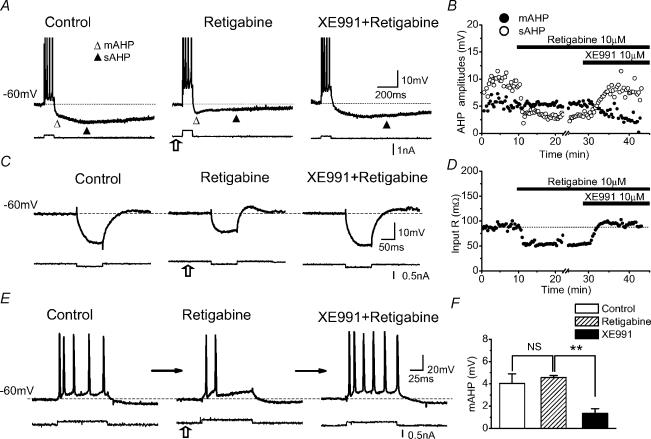
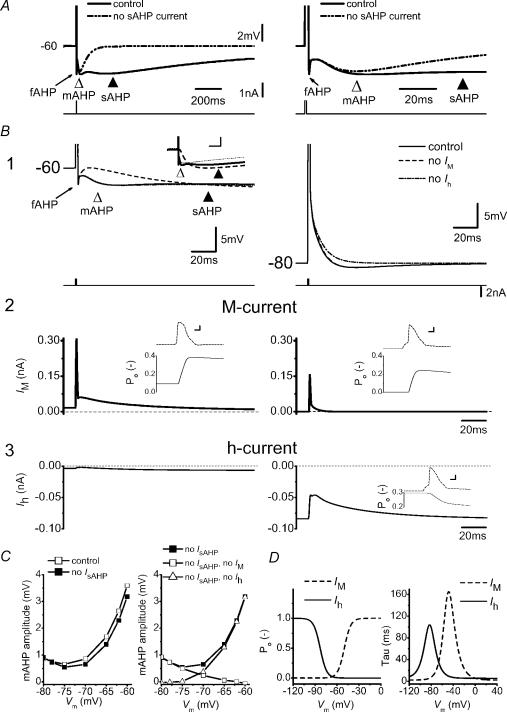
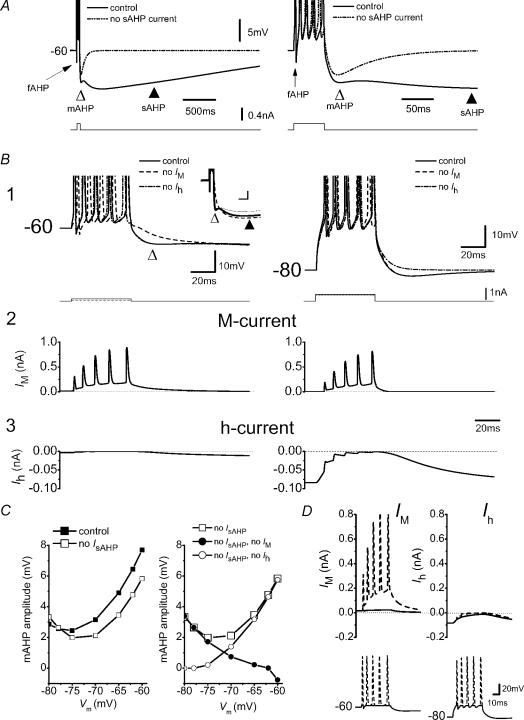
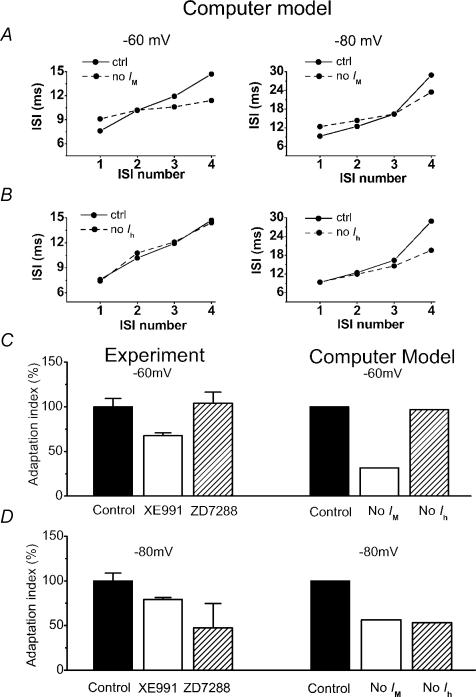
In hippocampal pyramidal cells, a single action potential (AP) or a burst of APs is followed by a medium afterhyperpolarization (mAHP, lasting approximately 0.1 s). The currents underlying the mAHP are considered to regulate excitability and cause early spike frequency adaptation, thus dampening the response to sustained excitatory input relative to responses to abrupt excitation. The mAHP was originally suggested to be primarily caused by M-channels (at depolarized potentials) and h-channels (at more negative potentials), but not SK channels. In recent reports, however, the mAHP was suggested to be generated mainly by SK channels or only by h-channels. We have now re-examined the mechanisms underlying the mAHP and early spike frequency adaptation in CA1 pyramidal cells by using sharp electrode and whole-cell recording in rat hippocampal slices. The specific M-channel blocker XE991 (10 microm) suppressed the mAHP following 1-5 APs evoked by current injection at -60 mV. XE991 also enhanced the excitability of the cell, i.e. increased the number of APs evoked by a constant depolarizing current pulse, reduced their rate of adaptation, enhanced the after depolarization and promoted bursting. Conversely, the M-channel opener retigabine reduced excitability. The h-channel blocker ZD7288 (4-ethylphenylamino-1,2-dimethyl-6-methylaminopyrimidinium chloride; 10 microm) fully suppressed the mAHP at -80 mV, but had little effect at -60 mV, whereas XE991 did not measurably affect the mAHP at -80 mV. Likewise, ZD7288 had little or no effect on excitability or adaptation during current pulses injected from -60 mV, but changed the initial discharge during depolarizing pulses injected from -80 mV. In contrast to previous reports, we found that blockade of Ca2+-activated K+ channels of the SK/KCa type by apamin (100-400 nm) failed to affect the mAHP or adaptation. A computational model of a CA1 pyramidal cell predicted that M- and h-channels will generate mAHPs in a voltage-dependent manner, as indicated by the experiments. We conclude that M- and h-channels generate the somatic mAHP in hippocampal pyramidal cells, with little or no net contribution from SK channels.


Figures

Figure 1
Figure 1. The mAHP in CA1 pyramidal neurones is not dependent on extracellular Ca2+
A, intracellular sharp-electrode recording showing typical example of the medium afterhyperpolarization (mAHP) in a rat CA1 pyramidal cell recorded after inhibition of the slow AHP (sAHP) with bath-applied forskolin (50 μm). Subsequent application of Ca2+-free extracellular medium with 2 mm Mn2+ caused no apparent change of the mAHP (overlay). The background membrane potential of the cell was kept at −60 mV by injecting steady depolarizing current. To evoke the mAHP and sAHP, a depolarizing current pulse was injected into the cell. The intensity of the current pulse was adjusted to evoke a constant number of action potentials (APs) per pulse (five). B, time course of the mAHP amplitude during the experiment shown in A. C, summary data showing the amplitude of mAHP before and after the application of Ca2+-free medium in the presence of forskolin in five cells. D, typical example of an AP, before and after applying Ca2+-free medium. Note that Ca2+-free medium caused a dual effect on the spike repolarization, reflected as a narrowing of the upper ∼two-thirds and broadening of the lower ∼one-third of the spike. E, time course of AP 90–10% decay time, showing the effect of Ca2+-free medium on spike repolarization during the experiment shown in D. A, B, D and E are records obtained from the same cell.
Figure 2
Figure 2. Effect of forskolin, apamin and XE991 on the mAHP and the sAHP
A, intracellular sharp electrode recording showing typical examples of the medium (mAHP, ▵) and slow (sAHP, ▴) afterhyperpolarizations in a CA1 pyramidal cell before (1) and after (2) bath-application of 50 μm forskolin, followed by 100 nm apamin (3), and then 10 μm XE991 (4). Inserts in A2 and 3 show the mAHP on an expanded scale. The background membrane potential of the cell was kept at −60 mV by injecting steady depolarizing current. XE991 caused the cell to depolarize, but this was compensated by decreasing the positive steady current (open arrow), thus keeping the membrane potential at −60 mV. To evoke the mAHP and sAHP, a depolarizing current pulse was injected into the cell. The intensity of the current pulse was adjusted to always evoke five APs per pulse. B, mAHP and sAHP traces from A are shown superimposed on an expanded scale: before and after forskolin (1), before and after apamin (2), before and after XE991 (3). Note that forskolin completely suppressed the sAHP, thereby also affecting the peak amplitude measurement of the mAHP (1, vertical dashed line). The latter effect is probably due to overlap of the mAHP and sAHP. In the presence of forskolin, the mAHP was unaffected by apamin (2), but was completely blocked and converted to an after-depolarization potential (ADP) by subsequent application of XE991 (3) (see also insert in A4). C, time course showing the effects of forskolin, apamin and XE991 on the amplitude of the mAHP (•) and sAHP (○) from the same cell as in A and B. D, summary graph showing the effect of forskolin, apamin and XE991 on the amplitude of the mAHP (filled columns) and sAHP (open columns) in all cells tested with these drugs (n = 4, *P < 0.05, **P < 0.01, NS P > 0.05).
Figure 3
Figure 3. Apamin-sensitive AHP (SK) current can be evoked in the presence of TTX and TEA, but does not contribute to the mAHP in normal extracellular medium
A, typical example of afterhyperpolarization (AHP) current recorded with whole-cell voltage-clamp in CA1 pyramidal neurones. The cell was voltage clamped at −50 to −55 mV with 1 μm TTX and 5 mm TEA in the bath. A 100 ms voltage step of sufficient amplitude (usually to 0 mV) to trigger a Ca2+ spike was applied to the cell to evoke AHP currents. Note that the outward tail current following the voltage step contains two components with different kinetics: a fast component (IAHP) of medium duration (∼200 ms) and a slow component (IsAHP) lasting several seconds. Apamin (100 nm) selectively inhibited IAHP, sparing IsAHP. The insets show IAHP before and after apamin on expanded scales. B, summary data showing time course of the normalized IAHP amplitude before and after apamin (n = 7). C, current-clamp recording obtained with a sharp intracellular electrode, showing that without the presence of TTX and TEA, the mAHP (▵) following a 400 ms train of 10 APs can not be blocked by 100 nm apamin. The recording temperature was 23°C. D, averaged time course showing the application of the selective SK-channel blocker apamin (100 nm) had no apparent effect on mAHP amplitude. (n = 6, P > 0.05)
Figure 4
Figure 4. Blockade of Im suppressed the mAHP at depolarized membrane potentials
A, whole-cell recording showing that blockade of M-current (Im) by 10 μm XE991 selectively suppressed the mAHP (▵) at a depolarized background membrane potential, −60 mV. Similar effects were seen in all five cells tested in this way. Note that the sAHP (▴) was enhanced by blocking Im with XE991. The insets show the mAHP (from the dashed box) on an expanded scale. B, sharp electrode intracellular recording showing that blockade of Im with XE991 had no apparent effect on the mAHP following a train of spikes evoked at a hyperpolarized background membrane potential −80 mV. The insets show the mAHP (dashed box) on expanded scales. The dashed lines in A and B indicate the membrane potential at which the neurones were maintained by constant current injection (−60 mV in A, and −80 mV in B). C and D, time courses from the experiments A and B, showing the XE911 effect on the mAHP amplitude while holding the membrane potential at −60 and −80 mV, respectively. E, summary data showing the voltage-dependent effect of XE991 on mAHP (at −60 mV, n = 5, **P < 0.01; at −80 mV, n = 5, NS P > 0.05).
Figure 5
Figure 5. Blockade of h-current (Ih) suppressed the mAHP at hyperpolarized membrane potentials
AD, the h-channel blocker ZD7288 (10 μm) suppressed the mAHP (▵) at −80 mV (C) but not at −60 mV (A). B and D, time courses of the ZD7288 effect on the mAHP amplitude from the experiments shown in A and C, respectively. The example illustrated in A and B was from a sharp electrode intracellular recording; the one shown in C and D was obtained with whole-cell patch-clamp recording. Note that ZD7288 enhanced the sAHP (▴) (A), and caused the cell to hyperpolarize, which was compensated by increasing the positive steady current to keep the membrane potential at −80 mV (open arrow). E, ZD7288 (10 μm) inhibited the Ih-dependent ‘sag’ evoked by a hyperpolarizing current pulse and increased the input resistance at −80 mV. F, time course of the ZD7288 effect on the cell input resistance, measured at the end of each current pulse. C and D, and E and F, are from the same cell. G, summary data (n = 10) showing the voltage-dependent effect of ZD7288 on ADP and mAHP (NS P > 0.05, **P < 0.01). H, normalized time course showing the average effect of ZD7288 on the mAHP and ADP at −60 mV (○) and at −80 mV (•).
Figure 6
Figure 6. Effects of XE991 on the afterpotentials following a single AP
Sharp-intracellular-electrode recordings showing the ADP (*) and mAHP (▵) following a single AP. Each AP was evoked by injecting a long lasting (2 s, A) or brief (2 ms, C) depolarizing current pulse into the neurone, starting from a membrane potential of −60 mV (maintained by steady depolarizing current injection). A, application of 10 μm XE991 first inhibited the mAHP and enhanced the ADP (10 min after onset of XE991 application), and subsequently caused discharge of a second AP (spike doublet; 13 min). C, XE991 application caused blockade of the mAHP and enhancement of the ADP (after 5 min), leading to an all-or-none burst discharge (after 10 min). Note that XE991 also caused the membrane potential to depolarize. Therefore, less positive holding current was needed to maintain the same potential compared to the control situation (lower traces in A; n = 10, P < 0.01). The insets in C show the mAHP and the ADP on expanded scales. B and D, time courses of the XE991 effect on the mAHP amplitude from the experiments shown in A and C, respectively. E and F, summary graphs of the XE991 effects from two different groups of experiments shown in A and C (each group: n = 5, P < 0.01).
Figure 7
Figure 7. XE991, but not apamin, increased neuronal excitability and bursting
A, the M-channel blocker XE991 caused a depolarization of the resting membrane potential (Vrest), accompanied by an increase in the input resistance. Typical example from a whole-cell recording. The cell was at Vrest (−70 mV); current pulses (1 s duration) of opposite polarity were injected. B and C, sharp electrode intracellular recording showing that XE991 increased excitability and promoted burst firing. The background membrane potential was maintained at −70 mV by injecting steady current, and a depolarizing current pulse (0.3 nA, 400 ms duration) was injected every 20 s. Application of XE991 depolarized the cell, and transformed its response to a high-frequency burst followed by a sAHP (▴ in B). A similar burst response was also observed when the background depolarization caused by XE991 was reversed by adjusting the steady current injection (C). Similar results were obtained in all cells tested in these ways (A, n = 5; B, n = 6). D, XE991, but not apamin, increased the excitability of CA1 pyramidal cells; typical example from a sharp electrode intracellular recording. Responses to injection of 400-ms-long depolarization and hyperpolarizing current pulses of ±0.2 nA are shown superimposed. E, time course of changes in average AP frequency from the cell illustrated in D, before and after application of apamin followed by XE991. The AP frequency was calculated by averaging the instantaneous frequencies (i.e. 1/interspike interval) for all APs during each current pulse. F and G, summary time courses for all cells tested with apamin (F, n = 5) and XE991 (G, n = 5), showing the effects of these blockers on the average AP frequency. H, summary data, average AP frequencies resulting from application of apamin (n = 5) and XE991 (n = 5) versus normal medium prior to drug application (control) for all cells tested (**P < 0.01; NS P > 0.05).
Figure 8
Figure 8. Complex changes in excitability resulting from Ih blockade by ZD7288
A, typical example from whole-cell recording: ZD7288 caused a hyperpolarization of Vrest, accompanied by an increase in the input resistance. The cell was at Vrest (−76 mV); current pulses (1 s duration) of opposite polarity were injected. Application of ZD7288 (10 μm) hyperpolarized the cell (in this case by 8 mV, from −76 to −84 mV), eliminated the Ih-dependent ‘overshoots’, ‘sags’ and ‘rebounds’ in the voltage responses; instead a slowly depolarizing ramp appeared in response to depolarizing pulses. B and C, sharp electrode recording; the cell was at Vrest (in this case −65 mV). Application of ZD7288 again caused a hyperpolarization, thereby reducing the excitability of the neurone, manifested as fewer APs and longer discharge latency (related to the slow depolarizing ramp shown in A) in response to identical current pulses (B). However, when the hyperpolarizing effect of ZD7288 was compensated by steady depolarizing current injection, the same cell fired more APs in response to same current pulse, indicating increased excitability (C), presumably due to increased input resistance, as shown in A. Thus, ZD7288 caused both an apparent ‘increase’ and an apparent ‘decrease’ in excitability in the same cell, depending on how it was tested. Similar effects were observed in all cells tested in this way (n = 4).
Figure 9
Figure 9. Im and Ih regulate early spike frequency adaptation in a voltage-dependent manner
AD, XE991 (10 μm) reduced the early spike frequency adaptation, at background membrane potentials of −60 mV (A and B) and −80 mV (C and D). The cell was kept either at −60 mV (A) or at −80 mV (C) by steady current injection. A depolarizing current pulse lasting 50 (A) or 100 ms (C) was injected every 20 s to evoke constant number (5) of APs. At −80 mV (C), 100 ms pulse duration was used, because 50 ms was often insufficient for evoking five APs. The first to the fourth interspike intervals (ISIs) were compared before and after each drug application. B and D, summary data of spike frequency adaptation before and after XE991 at −60 mV (B) and at −80 mV (D). Note that XE991 inhibited early spike frequency adaptation at −60 mV, manifested as reduction of the second to fourth ISIs. However, at −80 mV, XE991 only significantly reduced the second and third ISIs. E, typical responses to subthreshold depolarizing current pulse injection (1 s duration) before and after XE991 application. The overshoot (↓) and sag in the control condition was inhibited by XE991. In order to obtain responses of comparable, subthreshold amplitudes, the current pulse amplitude was reduced to compensate for the increased input resistance induced by XE991, and the XE991-induced depolarization was compensated by reducing the positive holding current (open arrow). F–I, typical examples showing the effect of ZD7288 on early spike frequency adaptation at −60 mV (F–G) and −80 mV (H–I). Note that ZD7288 reduced early spike frequency adaptation only when spikes were evoked from −80 mV, reflected as changes in the second to fourth ISIs (summary data in G and I). A, whole-cell recording; C, E, F and H, sharp electrode intracellular recordings.
Figure 10
Figure 10. The effect of the Kv7/KCNQ/M-channel opener retigabine on the mAHP, early spike frequency adaptation and input resistance
A and B, mAHP (▵) and sAHP (▴) following a train of five spikes, recorded under normal conditions, followed by application of 10 μm retigabine and subsequently 10 μm XE991. Retigabine caused the cell to hyperpolarize, but this was reversed by increasing the positive steady current to keep the membrane potential at −60 mV (open arrow). However, retigabine had no apparent effect on the mAHP, whereas the sAHP was reduced by ∼50%. XE991 blocked the mAHP and fully reversed the effect of retigabine on the sAHP and membrane potential. B, time courses of the mAHP (•) and sAHP (○) amplitudes during the experiment illustrated in A. C and D, retigabine reduced the input resistance at −60 mV by 38.9 ± 3.1% (mean ± s.e.m.), and increased the rebound; both effects were blocked by XE991 (same cell as in A and B). E, retigabine reduced the excitability of the cell, reflected as fewer APs evoked by a current pulse of constant amplitude. The open arrows in A, C and E indicate that less positive steady current was injected into the neurone after retigabine to keep it at −60 mV, reflecting that retigabine had a hyperpolarizing effect. F, summary data showing the effect of retigabine and XE991 on the mAHP amplitude (n = 4, NS P > 0.05, **P < 0.01). All cells were obtained with sharp electrode recording.
Figure 11
Figure 11. Modelling study of the mAHP following a single AP
A, a single AP evoked by a current pulse (1 ms) while holding the membrane potential at −60 mV by steady-state current. Simulations were repeated with and without sAHP current. The left- and right-hand panels show the same simulations at different time scales. B1, same protocol as A while holding the membrane potential at different levels, as indicated. Superimposed voltage responses of simulations are shown of ‘control’ or with either ‘no Im’ or ‘no Ih’. B1, inset, (at a different scale) the AHPs following a single spike evoked at −60 mV, in normal conditions (control, continuous line), without Im (‘no Im’, dashed line) and with a −7 mV negative shift of the Im steady-state activation curve, i.e. resembling the retigabine effect (thin dotted line). Note that blocking Im or shifting its activation curve towards more negative potentials, increases and decreases the sAHP, respectively. B2 and B3, Im and Ih responses, respectively, during the protocol shown in B1. Insets show the open probability (Po) of Im (B2) or Ih (B3) during the AP. C, left panel, summary data of the mAHP amplitude at various holding potentials with or without sAHP current. Right panel, voltage dependence of the amplitude of the isolated mAHP (i.e. without sAHP current) with either Im or Ih blocked. D, voltage dependence of the Po (left) and time constant (right) of Im and Ih. Scale bar of insets in B1: 100 ms, 2 mV; B2 and B3: 0.5 ms, 20 mV.
Figure 12
Figure 12. Modelling study of the mAHP following a train of APs
A, train of APs evoked by a current pulse (50 ms) while holding the membrane potential at −60 mV by steady-state current. Simulations were repeated with and without sAHP current. The left- and right-hand panels show the same simulations at different time scales. B1, same protocol as A while holding the membrane potential at different levels as indicated. Voltage responses of simulations of normal conditions or with either ‘no Im’ or ‘no Ih’ are shown superimposed. The inset in B1 shows the AHPs following a five-spike train evoked at −60 mV, in normal conditions (control, continuous line), without Im (‘no Im’, dashed line) and with a −7 mV negative shift of the Im steady-state activation curve, i.e. resembling the retigabine effect (thin dotted line). Note that blocking Im, or shifting its activation curve, increases and decreases the sAHP, respectively. B2 and B3, Im and Ih response, respectively, during the protocol shown in B1. C, left panel, summary data of the mAHP amplitude at various holding potentials with or without sAHP current. Right panel, voltage dependence of the amplitude of the isolated mAHP (i.e. without sAHP current) with either Im or Ih blocked. D, to determine whether Im and Ih are activated and deactivated, respectively, by the APs or by the interspike depolarized plateau during a spike train (as in B), we compared Im and Ih during voltage responses with and without spikes. The voltage responses from the simulations in B1 at −60 and −80 mV, with or without spikes, were used as voltage-clamp commands (lower panels, dashed traces and continuous lines, respectively). The APs were clipped at the threshold. Upper panels, Im (left) and Ih (right) during the voltage-clamp command, before (dashed traces) and after (continuous lines) clipping the APs. Note that Im was strongly reduced by eliminating the spikes, indicating that it was mainly activated during the APs. In contrast, Ih was little affected by clipping the spikes, showing that it was mainly activated by the depolarized plateau. Inset scale bar of B1: 100 ms, 2 mV.
Figure 13
Figure 13. Contributions of Im and Ih to spike frequency adaptation during repetitive firing: comparing experimental and modelling results
By using the same computer model as in Figs 11 and 12, a train of five APs was evoked by a 50 ms current pulse. The first to the fourth ISIs were compared with and without Im (A) and Ih (B) while holding the cell at −60 mV (left) and −80 mV (right). C and D, bars show the normalized adaptation index from experiment data (left) compared with the results from the modelling study (right), at background membrane potentials of −60 (C) and −80 mV (D). The adaptation index was defined as the slope of the line that fitted best to the plot of the four ISIs (first to fourth ISIs), as shown in A and B. In both the experiments and the modelling, we consistently found at −60 mV that elimination of Im reduced the adaptation index, whereas elimination of Ih had little effect. In contrast, at −80 mV, elimination of either Im or Ih significantly reduced the adaptation index.

Similar articles

Cited by

References

    1. Abel HJ, Lee JC, Callaway JC, Foehring RC. Relationships between intracellular calcium and afterhyperpolarizations in neocortical pyramidal neurons. J Neurophysiol. 2004;91:324–335. - PubMed
    1. Aiken SP, Zaczek R, Brown BS. Pharmacology of the neurotransmitter release enhancer linopirdine (DuP 996), and insights into its mechanism of action. Adv Pharmacol. 1996;35:349–384. - PubMed
    1. Biervert C, Schroeder BC, Kubisch C, Berkovic SF, Propping P, Jentsch TJ, Steinlein OK. A potassium channel mutation in neonatal human epilepsy. Science. 1998;279:403–406. - PubMed
    1. Bond CT, Maylie J, Adelman JP. Small-conductance calcium-activated potassium channels. Ann N Y Acad Sci. 1999;868:370–378. - PubMed
    1. Borgatti R, Zucca C, Cavallini A, Ferrario M, Panzeri C, Castaldo P, Soldovieri MV, Baschirotto C, Bresolin N, Dalla BB, Taglialatela M, Bassi MT. A novel mutation in KCNQ2 associated with BFNC, drug resistant epilepsy, and mental retardation. Neurology. 2004;63:57–65. - PubMed

Publication types

MeSH terms

Substances

LinkOut - more resources