. 2005 Sep;33(3):231-47.
doi: 10.1165/rcmb.2005-0109OC. Epub 2005 May 12.

Proteinase-activated receptor-1 mediates elastase-induced apoptosis of human lung epithelial cells

Affiliations

Proteinase-activated receptor-1 mediates elastase-induced apoptosis of human lung epithelial cells

Tomoko Suzuki et al. Am J Respir Cell Mol Biol. 2005 Sep.

Abstract

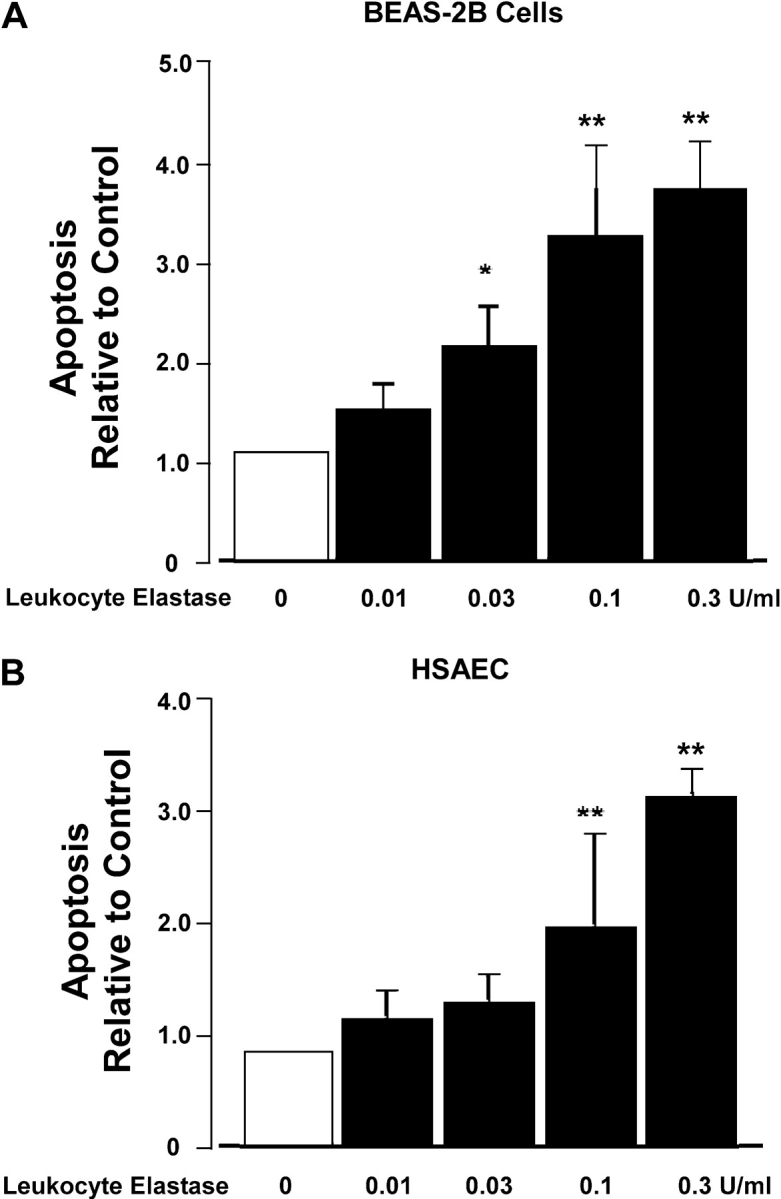
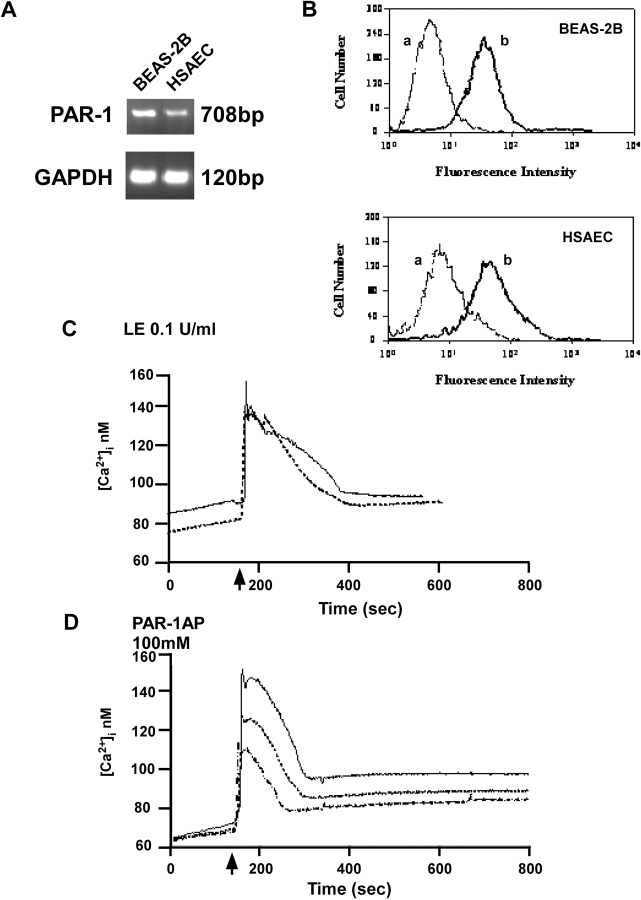
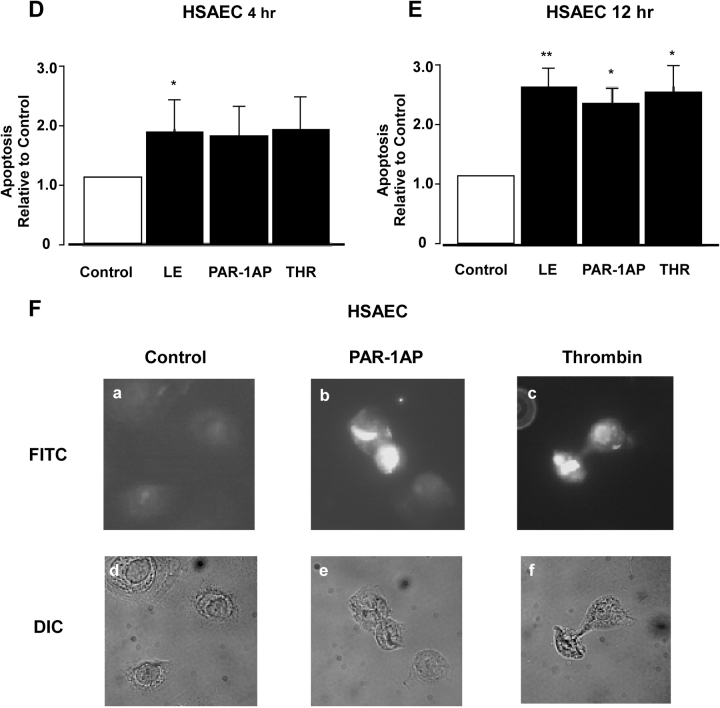
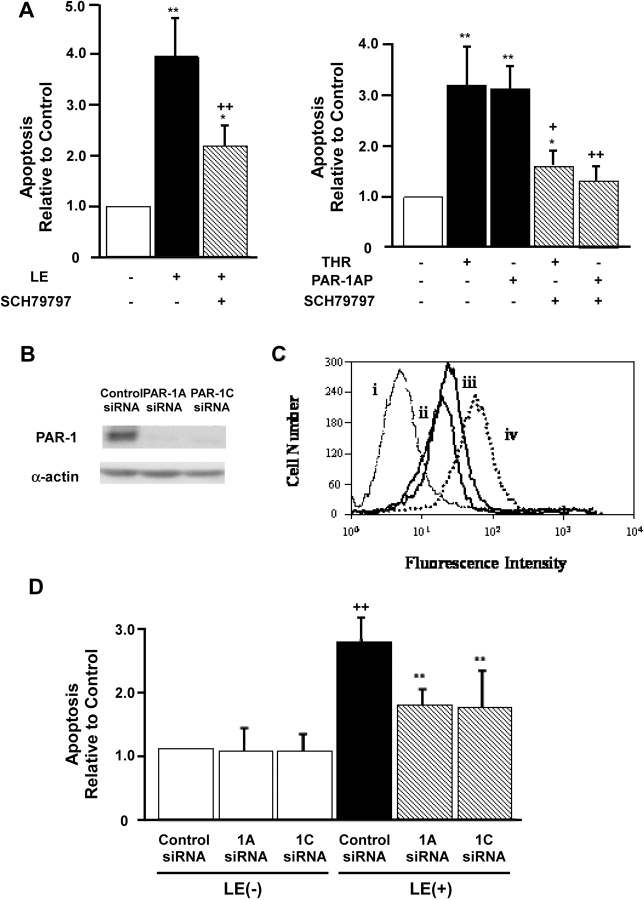
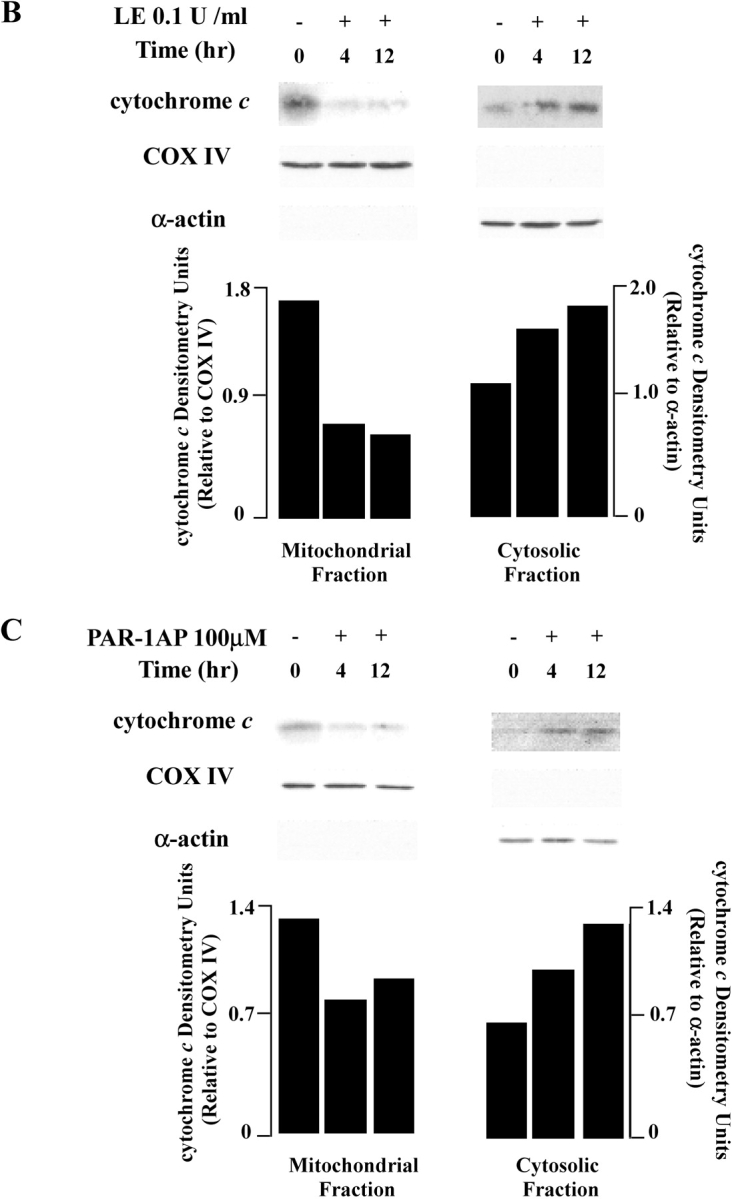
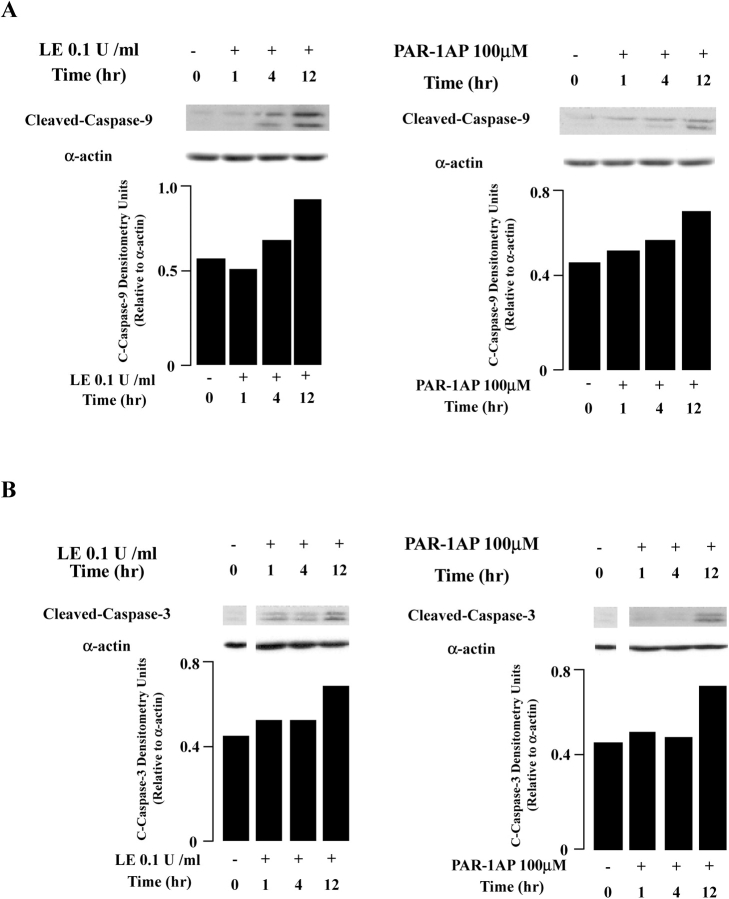
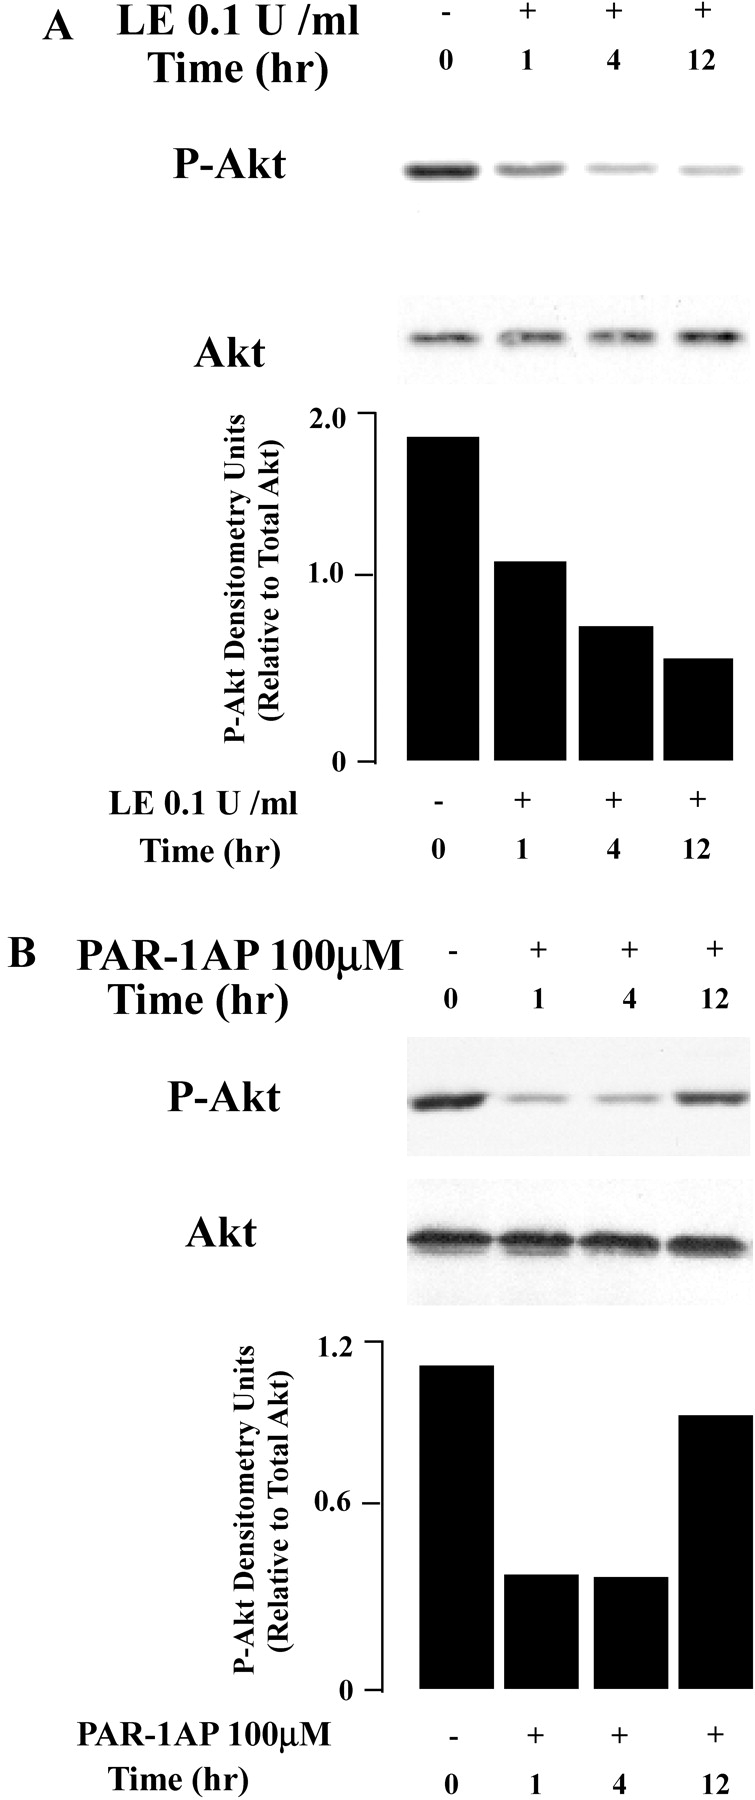
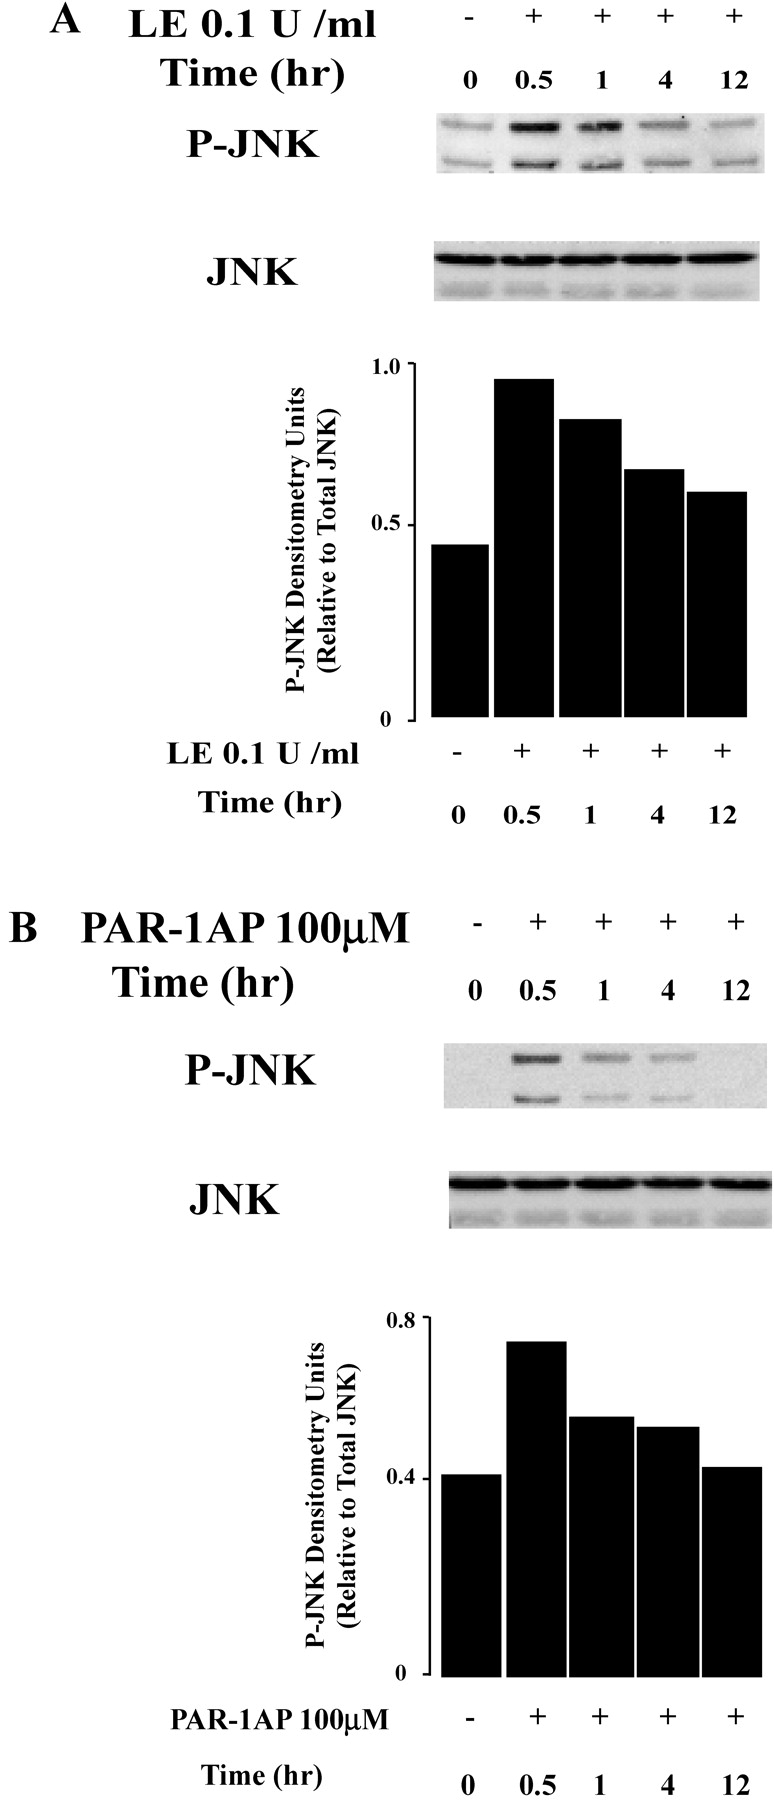
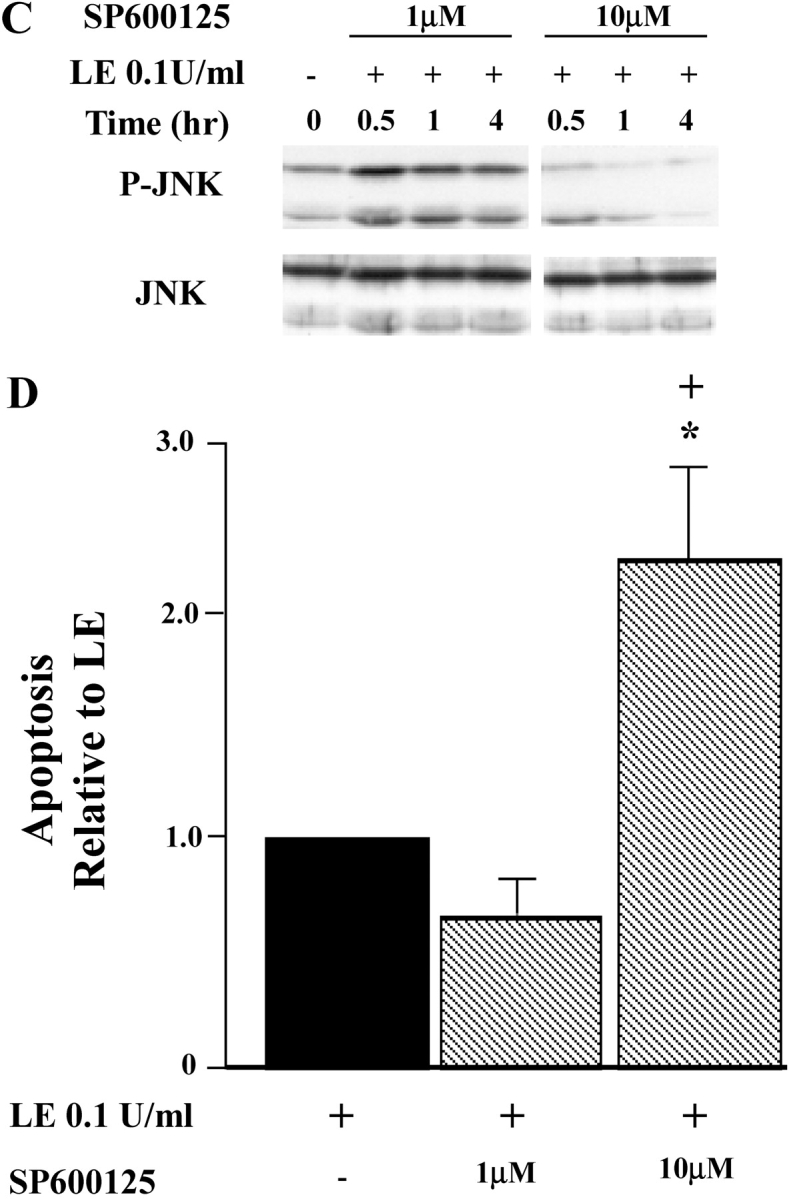
Apoptosis of distal lung epithelial cells plays a pivotal role in the pathogenesis of acute lung injury. In this context, proteinases, either circulating or leukocyte-derived, may contribute to epithelial apoptosis and lung injury. We hypothesized that apoptosis of lung epithelial cells induced by leukocyte elastase is mediated via the proteinase activated receptor (PAR)-1. Leukocyte elastase, thrombin, and PAR-1-activating peptide, but not the control peptide, induced apoptosis in human airway and alveolar epithelial cells as assessed by increases in cytoplasmic histone-associated DNA fragments and TUNEL staining. These effects were largely prevented by a specific PAR-1 antagonist and by short interfering RNA directed against PAR-1. To ascertain the mechanism of epithelial apoptosis, we determined that PAR-1AP, thrombin, and leukocyte elastase dissipated mitochondrial membrane potential, induced translocation of cytochrome c to the cytosol, enhanced cleavage of caspase-9 and caspase-3, and led to JNK activation and Akt inhibition. In concert, these observations provide strong evidence that leukocyte elastase mediates apoptosis of human lung epithelial cells through PAR-1-dependent modulation of the intrinsic apoptotic pathway via alterations in mitochondrial permeability and by modulation of JNK and Akt.


Figures

<b>Figure 1.</b>
Figure 1.
Leukocyte elastase (LE) induces lung epithelial apoptosis in a dose-dependent manner. Cell death detection assay (A–C) and TUNEL staining (D–F) were used for the detection of apoptosis. Three different lung epithelial cell types BEAS-2B (A and D), human small airway epithelial (HSAE) cells (B and E), and primary human alveolar type II (HAEC) cells (C and F) were used. In experiments with HSAE cells, many cells lifted off the coverslip during washing. Therefore, we collected cells in the supernatant and applied them to slides using a cytocentrifuge. The graphs (A–C) represent the absorbance values relative to control (buffer only). Values are mean ± SD; *P < 0.05 and **P < 0.01 compared with control. (A) n = 10; (B and C) n = 4. For TUNEL labeling (D–F), apoptotic cells demonstrate a greater intensity of fluorescence. Representative data each from one of three experiments are shown.
<b>Figure 2.</b>
Figure 2.
Expression of PAR-1 in lung epithelia as determined by RT-PCR and flow cytometry. (A) PAR-1 mRNA is detected in BEAS-2B and HSAE cells using RT-PCR. Upper panel represents PAR-1 and lower panel represents GAPDH expression, the latter used as a “housekeeping” gene. (B) Detection of PAR-1 cell surface receptor expression by FACS analysis. Cells were incubated with PAR-1 mouse monoclonal antibody FITC-conjugated (b) or with normal mouse IgG1 FITC conjugated (a). Representative data each from one of four experiments are shown. (C and D) Functionality of PAR-1 as determined by [Ca2+]i fluxes. Cells were challenged leukocyte elastase (LE) 0.1 U/ml or PAR-1AP 100 μM (arrow). Representative data each from one of three independent experiments are shown.
<b>Figure 3.</b>
Figure 3.
PAR-1 agonists induce lung epithelial apoptosis. Apoptosis was assessed using histone-associated DNA fragments (Cell Death Detection assay; A, B, D, E, G, H) at 4 and 12 h after the treatment with a control peptide (Control) 100 μM, leukocyte elastase (LE) 0.1 U/ml, PAR-1AP 100 μM, or Thrombin 1 U/ml. BEAS-2B cells were used in A and B, HSAE cells were used in D and E, and human alveolar epithelial (HAEC) cells were used in G and H. Values represent the mean ± SD; *P < 0.05 and **P < 0.01 compared with control. (A) n = 4; (B) n = 7; (D, E, G, H) n = 3. Apoptosis of lung epithelial cells, including BEAS-2B cells (C), HSAE cells (F), and HAEC (I) was determined using TUNEL labeling. Representative data from one of three experiments are shown.
<b>Figure 4.</b>
Figure 4.
PAR-1 siRNA diminishes PAR-1 expression and inhibits leukocyte elastase (LE)-induced apoptosis in BEAS-2B cells. (A) The selective pharmacologic inhibitor of PAR-1, SCH79797, attenuates epithelial apoptosis by leukocyte elastase and thrombin. The data represent the mean ± SEM of n = 3 experiments. (B) Upper panel represents PAR-1 expression and the lower panel illustrates α-actin protein expression using with Western blot analysis. (C) PAR-1, cell surface receptor as detected by FACS analysis. Cells were incubated with a FITC-conjugated PAR-1 murine monoclonal antibody 72 h after transfection with control siRNA (iv), PAR-1A siRNA (ii), and PAR-1C siRNA (iii). Histogram (i) represents staining with FITC-conjugated isotype control murine IgG1. Representative data each from one of five experiments are shown. (D) PAR-1 siRNA reduces leukocyte elastase–induced lung epithelial apoptosis. BEAS-2B cells were treated with leukocyte elastase 0.1 U/ml or buffer 12 h after transfection with siRNA. Values are mean ± SD; ++P < 0.01 compared with the sample of control siRNA transfection and buffer only incubation, **P < 0.01 compared with the sample of control siRNA transfection and leukocyte elastase treatment (n = 5).
<b>Figure 5.</b>
Figure 5.
Leukocyte elastase (LE) and PAR-1 agonists reduce mitochondrial membrane potential (ΔΨ) in BEAS-2B cells. (A) Upper panels represent images acquired with a rhodamine filter, middle panels with an FITC filter, and lower panels show DIC images. Cells were treated with a control peptide 100 μM, valinomicin 1 μM, leukocyte elastase 0.1 U/ml, PAR-1AP 100 μM, and thrombin 1 U/ml for 1 h. Representative data each from one of five experiments are shown. (B and C) Cytochrome c release from mitochondria to cytosol in epithelial cells exposed to leukocyte elastase and PAR-1AP. Cells fractions were collected after 0, 4, 12 h of incubation. COX IV is used as a marker for the mitochondrial fraction and α-actin as a marker for the cytosolic fraction. The graph shows densitometry units normalized for COX IV and α-actin levels. Representative data each from one of four experiments are shown.
<b>Figure 6.</b>
Figure 6.
Caspase activation by leukocyte elastase (LE) and PAR-1AP exposure in lung epithelial cells. A illustrates cleavage of caspase-9, and B illustrates cleavage of caspase-3 in BEAS2-B epithelial cells by Western blot analysis. The graph represents quantification by densitometry normalized for levels of α-actin. Representative data each from one of three experiments are shown.
<b>Figure 7.</b>
Figure 7.
Akt phosphorylation is reduced by exposure to leukocyte elastase (LE) and PAR-1AP. Western analysis of total protein from BEAS-2B cells collected at 0, 1, 4, and 12 h after exposure to leukocyte elastase (A) or PAR-1AP (B). The graph represents quantification by densitometry normalized for levels of total Akt. Representative data from one of five independent experiments are shown. (C) Western analysis of total protein from BEAS-2B cells collected after PAR-1A siRNA or control siRNA transfection followed by incubation with leukocyte elastase or buffer control. Phospho-Akt and total Akt were assessed at 0 and 12 h. The accompanying graph represents quantification by densitometry normalized for levels of total Akt. Representative data from one of three independent experiments are shown.
<b>Figure 8.</b>
Figure 8.
JNK phosphorylation is induced by exposure to leukocyte elastase (LE) and PAR-1AP. BEAS-2B cells were treated with leukocyte elastase (A) and PAR-1AP (B), and total protein was collected at 0, 0.5, 1, 4, and 12 h. The graph represents quantification by densitometry normalized for levels of total JNK. Representative data from one of four independent experiments are shown. (C) Cells were treated with SP600125, a specific JNK inhibitor 1 h before exposure to leukocyte elastase and PAR-1AP. Western blot analysis was used to assess levels of phospho-JNK and total JNK. (D) Treatment of cells with a JNK inhibitor enhances leukocyte elastase–induced epithelial apoptosis. Cells were pretreated with SP600125 1 μM and 10 μM and exposed to leukocyte elastase for an additional 12 h. The graph represents apoptosis relative to leukocyte elastase treatment samples. Values are mean ± SD; *P < 0.05 compared with the samples without SP600125; + P < 0.05 compared with the samples with SP600125 1 μM; n = 3.

Comment in

  • No bit PARt for PAR-1.
    Laurent GJ. Laurent GJ. Am J Respir Cell Mol Biol. 2005 Sep;33(3):213-5. doi: 10.1165/rcmb.F304. Am J Respir Cell Mol Biol. 2005. PMID: 16107573 No abstract available.

Similar articles

Cited by

References

    1. Havemann K, Gramse M. Physiology and pathophysiology of neutral proteinases of human granulocytes. Adv Exp Med Biol 1984;167:1–20. - PubMed
    1. Lee WL, Downey GP. Leukocyte elastase: physiological functions and role in acute lung injury. Am J Respir Crit Care Med 2001;164:896–904. - PubMed
    1. Cochrane CG, Spragg RG, Revak SD, Cohen AB, McGuire WW. The presence of neutrophil elastase and evidence of oxidation activity in bronchoalveolar lavage fluid of patients with adult respiratory distress syndrome. Am Rev Respir Dis 1983;127:S25–S27. - PubMed
    1. Collins JF, Anzueto AA, Peters JI, de los Santos R, Gonzalez DC, Johanson WG Jr, Seidenfeld JJ, Coalson JJ, Jenkinson SG. Elastase activity in bronchoalveolar lavage fluid from oxygen-exposed, Pseudomonas-infected baboons. Lung 1991;169:165–179. - PubMed
    1. Suter PM, Suter S, Girardin E, Roux-Lombard P, Grau GE, Dayer JM. High bronchoalveolar levels of tumor necrosis factor and its inhibitors, interleukin-1, interferon, and elastase, in patients with adult respiratory distress syndrome after trauma, shock, or sepsis. Am Rev Respir Dis 1992;145:1016–1022. - PubMed

Publication types

MeSH terms