

Proton MR spectroscopy in Wilson disease: analysis of 36 cases
- PMID: 15891161
- PMCID: PMC8158586
Proton MR spectroscopy in Wilson disease: analysis of 36 cases
Abstract
Background and purpose: Wilson disease (WD) is rare but one of the few metabolic disorders that can possibly benefit from effective available treatments. The literature regarding proton MR spectroscopy (MRS) in WD is scarce and controversial. The purpose of this study was to determine the brain metabolic changes due to WD by using MRS. To our knowledge, this is the first time that MRS was performed in such a large sample of patients with WD.
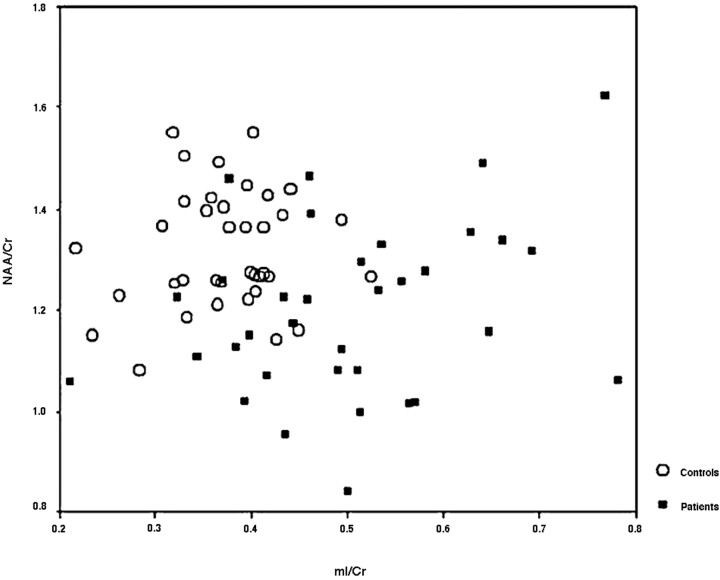
Methods: Thirty-six patients with WD and 37 healthy volunteers were examined with MRS in the parieto-occipital cortex, frontal white matter, and basal ganglia (BG). Ratios of the following metabolites were calculated in relation to creatine (Cr): N-acetylaspartate (NAA), choline (Cho), myo-inositol (mI), and glutamine/glutamate (Glx). The mean peak line width was measured on each spectrum.
Results: Compared with control subjects, patients with WD had significantly decreased NAA/Cr ratios in the three studied areas (P < .005) and an increased mI/Cr ratio in the BG (P < .001). Cho/Cr and Glx/Cr did not differ between the groups. The mean peak line in the BG was wider in patients than in control subjects.
Conclusion: WD is unequivocally associated with MRS changes that could possibly be assigned to neuronal loss (in the three studied areas), to gliosis, and to iron and/or copper deposition in the BG.
Figures


Similar articles
-
Metabolic changes in 37 newly diagnosed Wilson's disease patients assessed by magnetic resonance spectroscopy.Parkinsonism Relat Disord. 2009 Sep;15(8):582-6. doi: 10.1016/j.parkreldis.2009.02.007. Epub 2009 Apr 5. Parkinsonism Relat Disord. 2009. PMID: 19346156
-
Brain magnetic resonance spectroscopy (MRS) as a diagnostic tool for detecting early neurological changes in children with Wilson's disease.Eur J Radiol. 2019 Feb;111:41-46. doi: 10.1016/j.ejrad.2018.12.013. Epub 2018 Dec 14. Eur J Radiol. 2019. PMID: 30691663
-
Evaluation of early cerebral metabolic, perfusion and microstructural changes in HCV-positive patients: a pilot study.J Hepatol. 2013 Oct;59(4):651-7. doi: 10.1016/j.jhep.2013.05.008. Epub 2013 May 13. J Hepatol. 2013. PMID: 23680314
-
MR spectroscopy in monitoring the treatment of Wilson's disease patients.Mov Disord. 2008 Aug 15;23(11):1560-6. doi: 10.1002/mds.22163. Mov Disord. 2008. PMID: 18546325 Clinical Trial.
-
Proton magnetic resonance spectroscopy as a probe into the pathophysiology of autism spectrum disorders (ASD): a review.Autism Res. 2013 Apr;6(2):119-33. doi: 10.1002/aur.1273. Epub 2013 Feb 21. Autism Res. 2013. PMID: 23436782 Review.
Cited by
-
Diffusion tensor imaging (DTI) and its clinical correlates in drug naïve Wilson's disease.Metab Brain Dis. 2013 Sep;28(3):455-62. doi: 10.1007/s11011-013-9407-1. Epub 2013 May 1. Metab Brain Dis. 2013. PMID: 23636656
-
Magnetic resonance T2-relaxometry and 2D L-correlated spectroscopy in patients with minimal hepatic encephalopathy.J Magn Reson Imaging. 2009 Nov;30(5):1034-41. doi: 10.1002/jmri.21943. J Magn Reson Imaging. 2009. PMID: 19856435 Free PMC article.
-
Structural and neurochemical evaluation of the brain and pons in patients with Wilson's disease.Jpn J Radiol. 2010 Nov;28(9):663-71. doi: 10.1007/s11604-010-0491-4. Epub 2010 Nov 27. Jpn J Radiol. 2010. PMID: 21113750
-
Neuropsychiatric Manifestations of Wilson Disease: Correlation with MRI and Glutamate Excitotoxicity.Mol Neurobiol. 2021 Nov;58(11):6020-6031. doi: 10.1007/s12035-021-02525-4. Epub 2021 Aug 26. Mol Neurobiol. 2021. PMID: 34435331
-
Oromandibular Dystonia in Wilson's Disease.Mov Disord Clin Pract. 2015 May 9;2(3):253-259. doi: 10.1002/mdc3.12171. eCollection 2015 Sep. Mov Disord Clin Pract. 2015. PMID: 30363463 Free PMC article.
References
-
- Walshe JM. Wilson’s disease. In: Vinken PJ, Bruyn GW, Klawans HL, eds. Extrapyramidal Disorders. New York: Elsevier Science;1986. :223–238
-
- Brewer GJ, Yuzbasiyan-Gurkan V. Wilson disease. Medicine (Baltimore) 1992;71:139–164 - PubMed
-
- Brewer GJ, Fink JK, Hedera P. Diagnosis and treatment of Wilson’s disease. Semin Neurol 1999;19:261–270 - PubMed
-
- Magalhaes AC, Caramelli P, Menezes JR, et al. Wilson’s disease: MRI with clinical correlation. Neuroradiology 1994;36:97–100 - PubMed
Publication types
MeSH terms
LinkOut - more resources
Full Text Sources
Medical