Clinical Trial
. 2005 May;26(5):1186-92.

Usefulness of the apparent diffusion coefficient in line scan diffusion-weighted imaging for distinguishing between squamous cell carcinomas and malignant lymphomas of the head and neck

Affiliations
Clinical Trial

Usefulness of the apparent diffusion coefficient in line scan diffusion-weighted imaging for distinguishing between squamous cell carcinomas and malignant lymphomas of the head and neck

Masayuki Maeda et al. AJNR Am J Neuroradiol. 2005 May.

Abstract

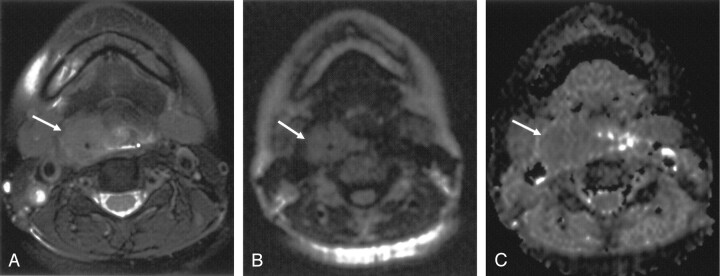
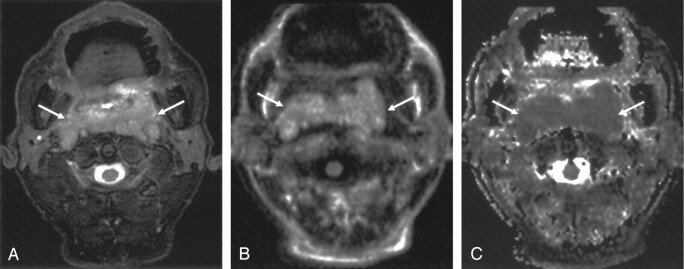
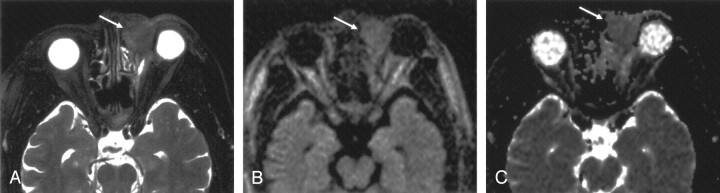
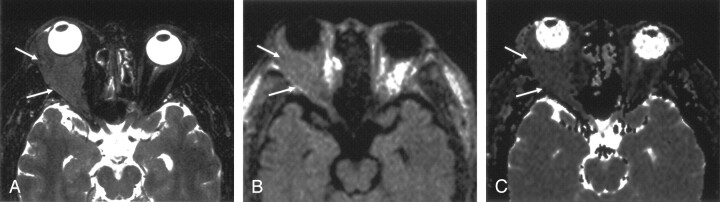
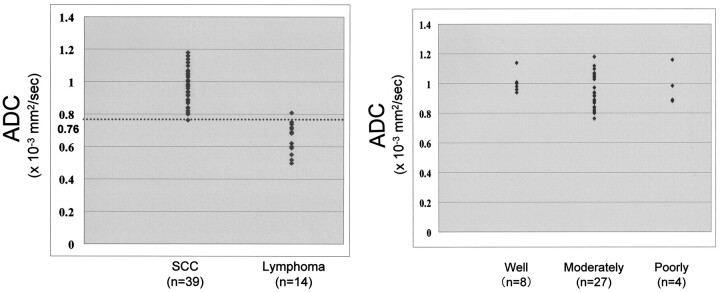
Background and purpose: Squamous cell carcinoma (SCC) and lymphoma are common malignant tumors of the head and neck. The purpose of this study was to determine whether the apparent diffusion coefficient (ADC) in line scan diffusion-weighted imaging (LSDWI) is useful for distinguishing between SCC and lymphoma of the head and neck.

Methods: LSDWI was prospectively performed in 39 patients with SCC and in 14 patients with lymphoma. Images were obtained with a diffusion-weighted factor (b factor) of 5 and 1000 s/mm(2), and ADC maps were generated. ADC values were measured for the two types of tumor.

Results: Mean ADC values were 0.96 +/- 0.11 x 10(-3) mm(2)/s for SCC and 0.65 +/- 0.09 x 10(-3) mm(2)/s for lymphoma; the difference was significant (P < .001). All but one of the patients with lymphoma had ADC values lower than the lowest ADC (0.76 x 10(-3) mm(2)/s) in patients with SCC. When an ADC of 0.76 x 10(-3) mm(2)/s was used to distinguish between SCC and lymphoma, accuracy was 98% (52 of 53 lesions).

Conclusion: ADC values appear to be useful for distinguishing between SCC and lymphoma in the head and neck.


Figures

F<sc>ig</sc> 1.
Fig 1.
Axial images obtained in a 46-year-old woman with moderately differentiated SCC of the hypopharynx. A, T2-weighted fat-suppressed MR image shows a mass (arrow) in the upper right pyriform sinus. B, LSDWI obtained with b = 1000 s/mm2 shows a mass (arrow). Anatomic details adjacent to the mass are clearly depicted and easily understood. C, Corresponding ADC map. ADC of the mass (arrow) is 0.94 × 10⁻³ mm2/s.
F<sc>ig</sc> 2.
Fig 2.
Axial images obtained in a 69-year-old man with diffuse large B-cell lymphoma of the nasopharynx. A, T2-weighted fat-suppressed MR image shows the mass (arrows). B, LSDWI obtained with b = 1000 s/mm2 shows the mass (arrows). C, Corresponding ADC map. ADC value of the mass (arrows) is 0.69 × 10⁻³ mm2/s.
F<sc>ig</sc> 3.
Fig 3.
Axial images obtained in a 68-year-old man with moderately differentiated SCC of the left lacrimal sac. A, T2-weighted fat-suppressed MR image shows the mass (arrow). B, LSDWI obtained with b = 1000 s/mm2 shows the mass (arrow). C, ADC map shows that the signal intensity of the mass (arrow) is slightly higher than that of normal brain parenchyma. ADC of the mass is 1.04 × 10⁻³ mm2/s.
F<sc>ig</sc> 4.
Fig 4.
Axial images obtained in a 57-year-old man with marginal zone B-cell lymphoma of the right orbit. A, T2-weighted fat-suppressed MR image shows the mass (arrows). B, LSDWI obtained with b = 1000 s/mm2 shows the mass (arrows). C, ADC map shows that the signal intensity of the mass (arrows) is slightly lower than that of normal brain parenchyma. ADC of the mass is 0.59 × 10⁻³ mm2/s.
F<sc>ig</sc> 5.
Fig 5.
Axial images obtained in a 69-year-old man with moderately differentiated SCC of the right ethmoid sinuses extending intracranially. A, T2-weighted fat-suppressed MR image shows the mass (arrows). B, Echo-planar DW image obtained with b = 1000 s/mm2 shows significant susceptibility artifacts due to a fixed partial denture, making it impossible to evaluate diffusion. C, LSDWI obtained with b = 1000 s/mm2 shows the mass (arrows) free from susceptibility artifacts.
F<sc>ig</sc> 6.
Fig 6.
Scatterplot of ADC values in SCC (n = 39) and lymphoma (n = 14). All but one of the patients with lymphoma had ADCs lower than the lowest ADC (0.76 × 10⁻³ mm2/s) in those with SCC. When an ADC of 0.76 × 10⁻³ mm2/s (dotted line) was used to distinguish between SCC and lymphoma, the accuracy was 98% (52 of 53 lesions).
F<sc>ig</sc> 7.
Fig 7.
Scatterplot of ADC values in well (n = 8), moderately (n = 27), and poorly (n = 4) differentiated SCCs. ADCs overlap in the three subtypes of SCC. Well or moderately differentiated SCC (n = 35) did not significantly differ from poorly differentiated SCC (n = 4).

References

    1. Warach S, Chien D, Li W, Ronthal M, Edelman RR. Fast magnetic resonance diffusion-weighted imaging of acute human stroke. Neurology 1992;42:1717–1723 - PubMed
    1. Warach S, Gaa J, Siewert B, et al. Acute human stroke studied by whole brain echo planar diffusion-weighted magnetic resonance imaging. Ann Neurol 1995;37:231–241 - PubMed
    1. Lovblad KO, Laubach HJ, Baird AE, et al. Clinical experience with diffusion-weighted MR in patients with acute stroke. AJNR Am J Neuroradiol 1998;19:1061–1066 - PMC - PubMed
    1. Gonzalez RG, Schaefer PW, Buonanno FS, et al. Diffusion-weighted MR imaging: Diagnostic accuracy in patients imaged within 6 hours of stroke symptom onset. Radiology 1999;210:155–162 - PubMed
    1. Sugahara T, Korogi Y, Kochi M, et al. Usefulness of diffusion-weighted MRI with echo-planar technique in the evaluation of cellularity in gliomas. J Magn Reson Imaging 1999;9:53–60 - PubMed

Publication types