. 2005 May;26(5):1201-6.

MR imaging of salivary duct carcinoma

Affiliations

MR imaging of salivary duct carcinoma

Ken Motoori et al. AJNR Am J Neuroradiol. 2005 May.

Abstract

Background and purpose: Salivary duct carcinoma (SDC) is regarded as a high-grade malignancy in the current classification of salivary gland neoplasms. The aim of our study was to describe the MR imaging features of SDC.

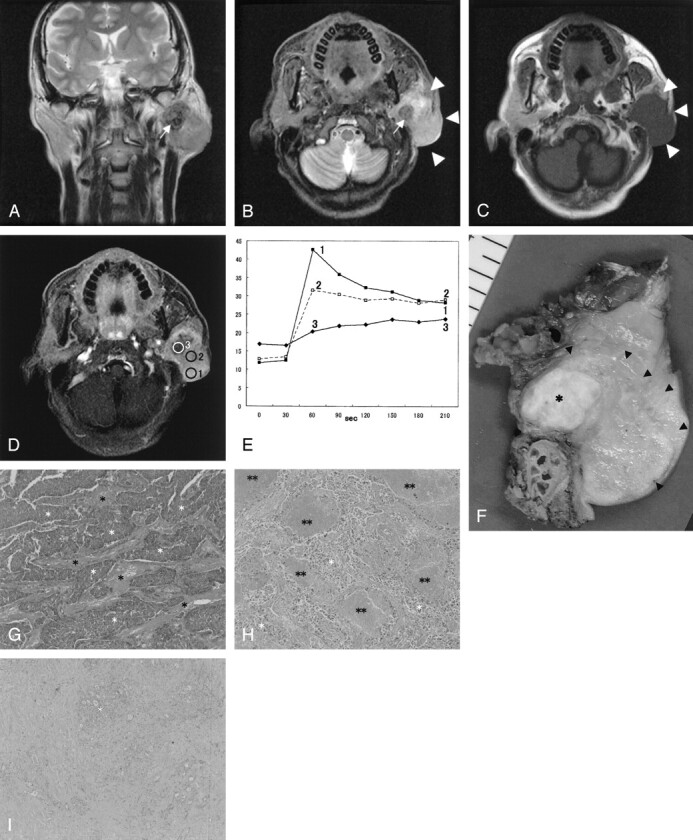
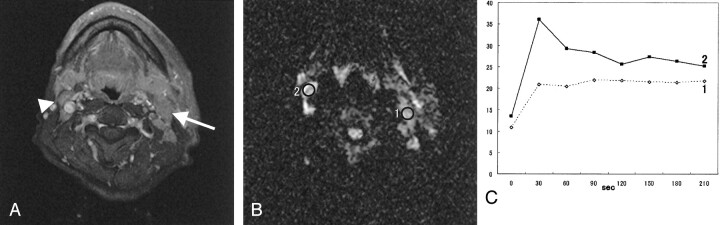
Methods: Nine patients with SDC underwent MR imaging study. The apparent diffusion coefficient (ADC) values of SDCs were measured from diffusion-weighted images. Time-signal intensity curves (TICs) of the tumors on dynamic MR images were plotted, and washout ratios were also calculated. TICs were divided into four types: type A, curve peaks <120 seconds after administration of contrast material with high washout ratio (> or =30%); type B, curve peaks <120 seconds with low washout ratio (<30%); type C, curve peaks >120 seconds; type D, nonenhanced. We correlated the MR findings of SDC with the pathologic findings.

Results: All tumors had ill-defined margins and showed low to moderately high signal intensity for contralateral parotid gland on T2-weighted images. The average of the ADC values of the SDCs was 1.16 +/- 0.14 [SD] x 10(-3)mm(2)/s. Seven of nine (78%) tumors had type B enhancement. On the other hand, six of nine (67%) tumors with rich fibrotic tissue also had type C enhancement.

Conclusion: The findings of ill-defined margin, early enhancement with low washout ratio (type B), and low ADC value (1.22 x 10(-3)mm(2)/s) were useful for suggesting malignant salivary gland tumors. Although it was reported that type C enhancement was specific for pleomorphic adenoma, SDC frequently has type C-enhanced focus.


Figures

F<sc>ig</sc> 1.
Fig 1.
SDC in the left parotid gland of a 48-year-old man. A, T2-weighted image (4000/104 [TR/TE], coronal plane) shows a tumor with ill-defined margin. The tumor shows low (arrow) to moderately high signal intensity for the contralateral parotid gland. B, STIR image (4000/30, axial plane) also shows a hypointensity focus (arrow) in the tumor. The border of the tumor is invasive (arrowheads). C, T1-weighted image (400/9, axial plane) shows an isointense tumor. D, Third phase images on dynamic study (6.3/1.4, axial plane) show irregular enhancement. Marked enhanced area (region of interest 1), well-enhanced area (region of interest 2), and gradual upward enhanced area (region of interest 3) are detected. E, Signal intensity graph shows that the washout ratio of region of interest 1 is 35% (type A) and that of region of interest 2 is 13% (type B). Time–signal intensity curves of region of interest 3 show gradual upward enhancement (type C). F, Radical parotidectomy including facial nerve, mastoid tip, and skin was performed. Tumor extension from the cut specimen (arrowheads) is in good agreement with the MR images. The focus showing hypointensity on STIR and T2-weighted images and gradual upward enhancement on dynamic MR images corresponding to the fibrotic area (asterisk). G, The light-optic appearance (original magnification ×40) in region of interest 1 shows abundant atypical epithelial cells (white asterisks) with fibrotic stromata (black asterisks). H, The light-optic appearance (original magnification ×40) in region of interest 2 shows atypical epithelial cells (white asterisks) with fibrotic stromata and many foci of comedonecrosis (double asterisks). I, The light-optic appearance (original magnification ×40) in region of interest 3 shows dense fibrotic tissue with cellular components (white asterisk).
F<sc>ig</sc> 2.
Fig 2.
SDC in the left parotid gland of a 52-year-old man. He has ipsilateral metastatic lymph nodes and contralateral reactive lymph nodes. A, Fat-suppression T1-weighted image (340/20, axial plane) shows multiple cervical lymphadenopathies. Metastatic lymph node (arrow) is >10 mm in minimal axial diameter. Reactive lymph node (arrowhead) is <10 mm in minimal axial diameter. B, On diffusion-weighted image (spin-echo single-shot echo-planar sequence with b factors of 0 and 1000 s/mm2), both lymph nodes show high signal intensity. The ADC value of the metastatic lymph node (region of interest 1) is 1.23 × 10⁻³ mm2/s and that of the reactive lymph node is 0.90 × 10⁻³ mm2/s. C, Signal intensity graph shows that the washout ratio of region of interest 1 is 2% (type B) and that of region of interest 2 is 48% (type A).

References

    1. Kleinsasser O, Klein HJ, Hubner G. Speichelgangcarcinomas: Ein den Milchgangcarcinomen der Brustdruse Analoge Gruppe von Speicheldrusentumoren. Arch Klin Exp Ohren Nasen Kehlkopfheikd 1968;192:100–105 - PubMed
    1. Seifert G, Sobin LH. Histological Typing of Salivary Gland Tumors: World Health Organization International Histological Classification of tumors. 2nd ed. New York: Springer-Verlag;1991
    1. Yabuuchi H, Fukuya T, Tajima T, et al. Salivary gland tumors: diagnostic value of gadolinium-enhanced dynamic MR imaging with histopathologic correlation. Radiology 2003;226:345–354 - PubMed
    1. Chen KT, Hafez GR. Infiltrating salivary duct carcinoma: a clinicopathologic study of five cases. Arch Otolaryngol 1981;107:37–39 - PubMed
    1. Chen KT. Intraductal carcinoma of the minor salivary gland. J Laryngol Otol 1983;97:189–191 - PubMed