. 2005;6(5):R43.
doi: 10.1186/gb-2005-6-5-r43. Epub 2005 Apr 13.

Dissection of a DNA-damage-induced transcriptional network using a combination of microarrays, RNA interference and computational promoter analysis

Affiliations

Dissection of a DNA-damage-induced transcriptional network using a combination of microarrays, RNA interference and computational promoter analysis

Ran Elkon et al. Genome Biol. 2005.

Abstract

Background: Gene-expression microarrays and RNA interferences (RNAi) are among the most prominent techniques in functional genomics. The combination of the two holds promise for systematic, large-scale dissection of transcriptional networks. Recent studies, however, raise the concern that nonspecific responses to small interfering RNAs (siRNAs) might obscure the consequences of silencing the gene of interest, throwing into question the ability of this experimental strategy to achieve precise network dissections.

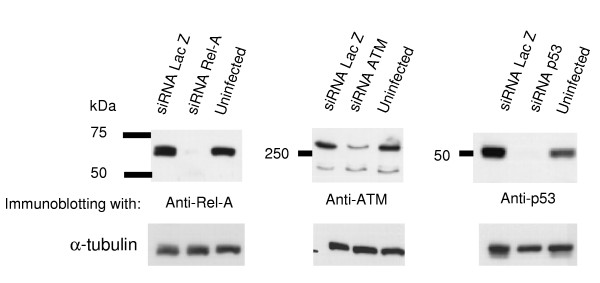
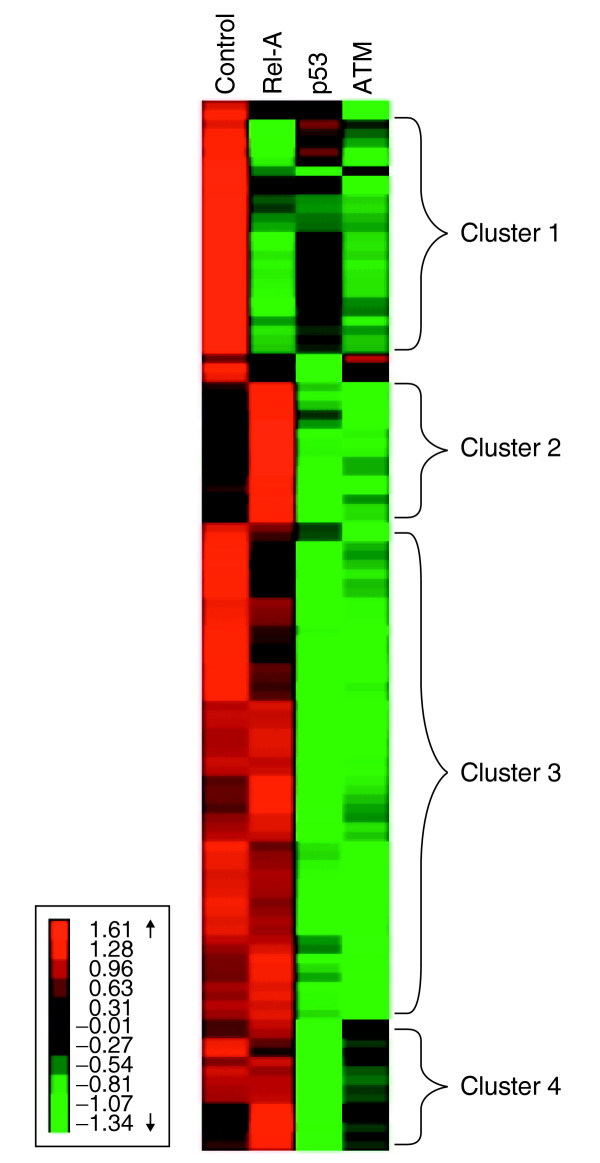
Results: We used microarrays and RNAi to dissect a transcriptional network induced by DNA damage in a human cellular system. We recorded expression profiles with and without exposure of the cells to a radiomimetic drug that induces DNA double-strand breaks (DSBs). Profiles were measured in control cells and in cells knocked-down for the Rel-A subunit of NFkappaB and for p53, two pivotal stress-induced transcription factors, and for the protein kinase ATM, the major transducer of the cellular responses to DSBs. We observed that NFkappaB and p53 mediated most of the damage-induced gene activation; that they controlled the activation of largely disjoint sets of genes; and that ATM was required for the activation of both pathways. Applying computational promoter analysis, we demonstrated that the dissection of the network into ATM/NFkappaB and ATM/p53-mediated arms was highly accurate.

Conclusions: Our results demonstrate that the combined experimental strategy of expression arrays and RNAi is indeed a powerful method for the dissection of complex transcriptional networks, and that computational promoter analysis can provide a strong complementary means for assessing the accuracy of this dissection.


Figures

Figure 1
Figure 1
Western blotting analysis showing the reduction in protein levels encoded by mRNAs that were targeted by siRNAs. α-Tubulin was used as a loading control.
Figure 2
Figure 2
The four major expression patterns in the damage-induced gene set revealed by cluster analysis. For each of the 112 damage-induced genes, the fold change in expression level 4 h after NCS treatment was computed in uninfected cells and in the cells knocked-down for Rel-A, p53 and ATM, yielding a 112 × 4 data matrix, with the rows corresponding to genes. This matrix was subjected to hierarchical clustering after normalizing the rows to have mean = 0 and SD = 1. The heat map visually represents the normalized matrix after being clustered. Red, green and black entries represent above-, below- and near-average fold change of induction, respectively. Four prominent expression patterns are evident. Cluster 1 represents genes whose induction is strongly attenuated in cells knocked-down for Rel-A and ATM (compared to the response in the control uninfected cells), and only partially attenuated in cells knocked-down for p53. Cluster 2 represents genes whose response is attenuated in cells knocked-down for p53 and ATM, but augmented in cells knocked-down for Rel-A. Cluster 3 represents genes whose response is attenuated in cells knocked-down for p53 and ATM, but not affected by knocking-down Rel-A. Cluster 4 represents genes whose response is markedly attenuated in cells knocked-down for p53, and only partially attenuated in cells knocked-down for ATM.

References

    1. Lee TI, Rinaldi NJ, Robert F, Odom DT, Bar-Joseph Z, Gerber GK, Hannett NM, Harbison CT, Thompson CM, Simon I, et al. Transcriptional regulatory networks in Saccharomyces cerevisiae. Science. 2002;298:799–804. doi: 10.1126/science.1075090. - DOI - PubMed
    1. Pilpel Y, Sudarsanam P, Church GM. Identifying regulatory networks by combinatorial analysis of promoter elements. Nat Genet. 2001;29:153–159. doi: 10.1038/ng724. - DOI - PubMed
    1. Segal E, Yelensky R, Koller D. Genome-wide discovery of transcriptional modules from DNA sequence and gene expression. Bioinformatics. 2003;19(Suppl 1):i273–i282. doi: 10.1093/bioinformatics/btg1038. - DOI - PubMed
    1. Tavazoie S, Hughes JD, Campbell MJ, Cho RJ, Church GM. Systematic determination of genetic network architecture. Nat Genet. 1999;22:281–285. doi: 10.1038/10343. - DOI - PubMed
    1. Hannon GJ. RNA interference. Nature. 2002;418:244–251. doi: 10.1038/418244a. - DOI - PubMed

Publication types

MeSH terms