

Robust detection of periodic time series measured from biological systems
- PMID: 15892890
- PMCID: PMC1168888
- DOI: 10.1186/1471-2105-6-117
Robust detection of periodic time series measured from biological systems
Abstract
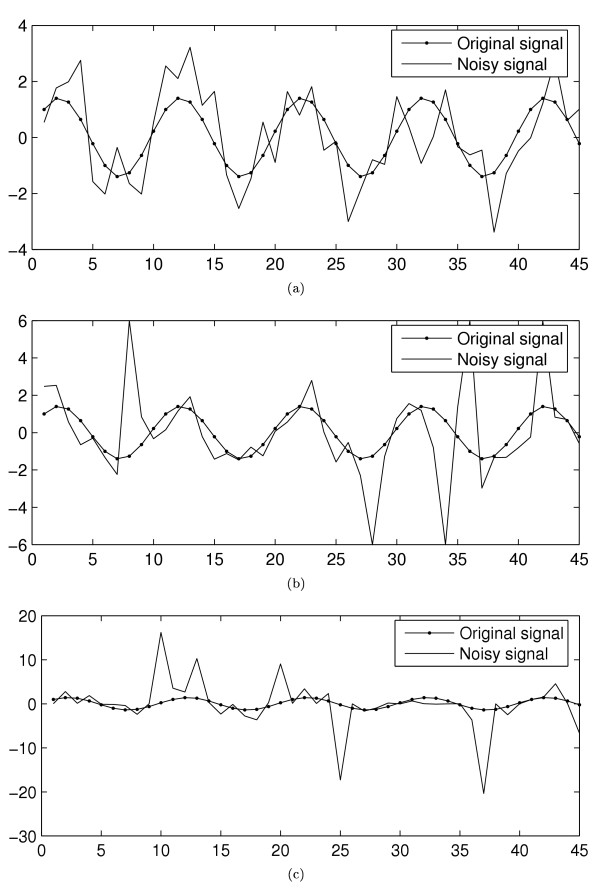
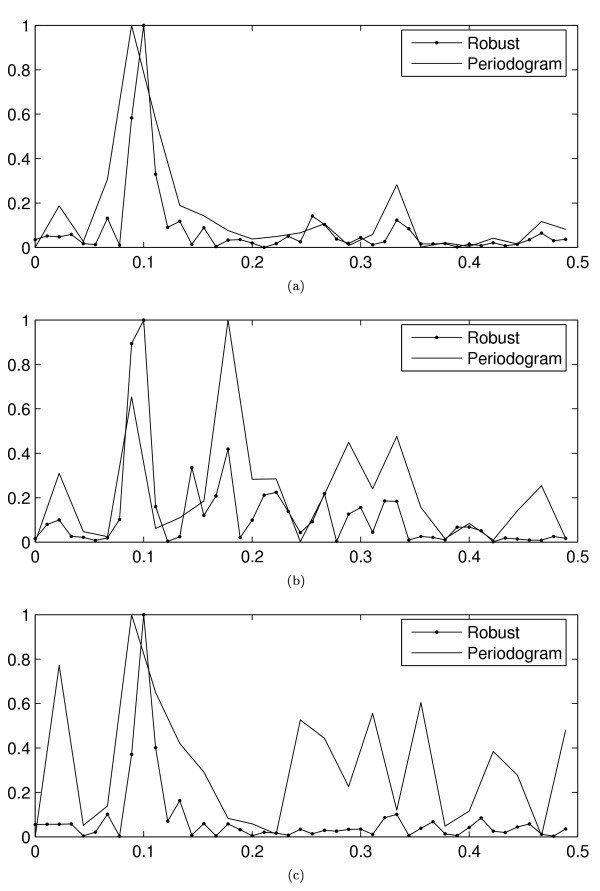
Background: Periodic phenomena are widespread in biology. The problem of finding periodicity in biological time series can be viewed as a multiple hypothesis testing of the spectral content of a given time series. The exact noise characteristics are unknown in many bioinformatics applications. Furthermore, the observed time series can exhibit other non-idealities, such as outliers, short length and distortion from the original wave form. Hence, the computational methods should preferably be robust against such anomalies in the data.
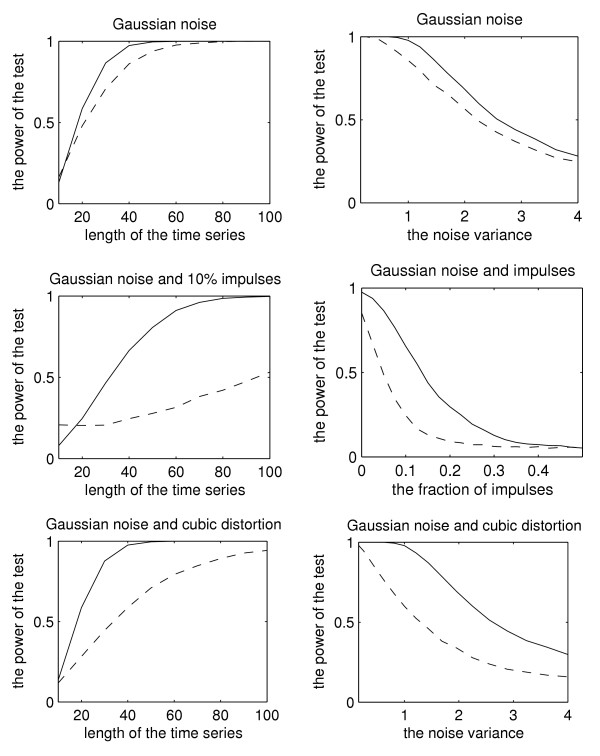
Results: We propose a general-purpose robust testing procedure for finding periodic sequences in multiple time series data. The proposed method is based on a robust spectral estimator which is incorporated into the hypothesis testing framework using a so-called g-statistic together with correction for multiple testing. This results in a robust testing procedure which is insensitive to heavy contamination of outliers, missing-values, short time series, nonlinear distortions, and is completely insensitive to any monotone nonlinear distortions. The performance of the methods is evaluated by performing extensive simulations. In addition, we compare the proposed method with another recent statistical signal detection estimator that uses Fisher's test, based on the Gaussian noise assumption. The results demonstrate that the proposed robust method provides remarkably better robustness properties. Moreover, the performance of the proposed method is preferable also in the standard Gaussian case. We validate the performance of the proposed method on real data on which the method performs very favorably.
Conclusion: As the time series measured from biological systems are usually short and prone to contain different kinds of non-idealities, we are very optimistic about the multitude of possible applications for our proposed robust statistical periodicity detection method.
Figures

References
-
- Tyson JJ. Biochemical oscillations. In: Fall C, Marland E, Wagner J, Tyson J, editor. Computational Cell Biology: An Introductory Text on Computer Modeling in Molecular and Cell Biology. New York: Springer-Verlag; 2002.
-
- Whitfield ML, Sherlock G, Saldanha AJ, Murray JI, Ball CA, Alexander KE, Matese JC, Perou CM, Hurt MM, Brown PO, Botstein D. Identification of genes periodically expressed in the human cell cycle and their expression in tumors. Mol Biol Cell. 2002;13:1977–2000. doi: 10.1091/mbc.02-02-0030.. - DOI - PMC - PubMed
Publication types
MeSH terms
LinkOut - more resources
Full Text Sources
