Naturally occurring antisense RNA of histone H2a in mouse cultured cell lines
- PMID: 15892893
- PMCID: PMC1156883
- DOI: 10.1186/1471-2156-6-23
Naturally occurring antisense RNA of histone H2a in mouse cultured cell lines
Abstract
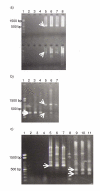
Background: An antisense transcript of histone H2a that has no significant protein-coding region has been cloned from a mouse full-length cDNA library. In the present study, we evaluated this transcript by using RT-PCR and compared the expression patterns of the sense and antisense transcripts by using quantitative RT-PCR (qRT-PCR).
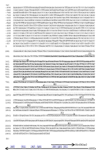
Results: This antisense RNA was expressed in three mouse cell lines. We call it ASH2a. ASH2a includes not only the complementary sequence of the transcript of Hist2h2aa2 (a replication-dependent histone H2a gene), but also that of the promoter of Hist2h2aa2. The upstream genomic sequence of the transcription start site of the ASH2a-coding gene (ASH2a) lacks both CCAAT and TATA boxes. This absence suggests that the regulation of ASH2a is different from that of the replication-dependent histone H2a genes. Findings from qRT-PCR indicated that the expression pattern of ASH2a was different from that of Hist2h2aa2. Expression of Hist2h2aa2 peaked at 2 to 4 h during S-phase, but that of ASH2a peaked at 1 h.
Conclusion: We showed the existence of ASH2a, a histone H2a antisense RNA, in mouse cultured cells. The expression pattern of ASH2a is different from that of the sense RNA.
Figures


Similar articles
-
Comparative analysis of expression of histone H2a genes in mouse.BMC Genomics. 2005 Aug 13;6:108. doi: 10.1186/1471-2164-6-108. BMC Genomics. 2005. PMID: 16098230 Free PMC article.
-
A novel replication-independent histone H2a gene in mouse.BMC Genet. 2005 Feb 19;6:10. doi: 10.1186/1471-2156-6-10. BMC Genet. 2005. PMID: 15720718 Free PMC article.
-
The mouse chemerin receptor gene, mcmklr1, utilizes alternative promoters for transcription and is regulated by all-trans retinoic acid.Gene. 2005 Apr 25;350(1):65-77. doi: 10.1016/j.gene.2005.02.004. Gene. 2005. PMID: 15792532
-
Identification and characterization of a novel antisense RNA transcribed from the opposite strand of the human blood group ABO gene.Transfusion. 2007 May;47(5):842-51. doi: 10.1111/j.1537-2995.2007.01198.x. Transfusion. 2007. PMID: 17465949
-
Regulation of the NPT gene by a naturally occurring antisense transcript.Cell Biochem Biophys. 2002;36(2-3):241-52. doi: 10.1385/CBB:36:2-3:241. Cell Biochem Biophys. 2002. PMID: 12139410 Review.
Cited by
-
Genomic landscape of developing male germ cells.Birth Defects Res C Embryo Today. 2009 Mar;87(1):43-63. doi: 10.1002/bdrc.20147. Birth Defects Res C Embryo Today. 2009. PMID: 19306351 Free PMC article. Review.
-
Transcriptome Analysis by RNA Sequencing of Mouse Embryonic Stem Cells Stocked on International Space Station for 1584 Days in Frozen State after Culture on the Ground.Int J Mol Sci. 2024 Mar 14;25(6):3283. doi: 10.3390/ijms25063283. Int J Mol Sci. 2024. PMID: 38542258 Free PMC article.
-
Comparative analysis of expression of histone H2a genes in mouse.BMC Genomics. 2005 Aug 13;6:108. doi: 10.1186/1471-2164-6-108. BMC Genomics. 2005. PMID: 16098230 Free PMC article.
-
Genome-wide in silico identification and analysis of cis natural antisense transcripts (cis-NATs) in ten species.Nucleic Acids Res. 2006 Jul 18;34(12):3465-75. doi: 10.1093/nar/gkl473. Print 2006. Nucleic Acids Res. 2006. PMID: 16849434 Free PMC article.
References
-
- Okazaki Y, Furuno M, Kasukawa T, Adachi J, Bono H, Kondo S, Nikaido I, Osato N, Saito R, Suzuki H, Yamanaka I, Kiyosawa H, Yagi K, Tomaru Y, Hasegawa Y, Nogami A, Schonbach C, Gojobori T, Baldarelli R, Hill DP, Bult C, Hume DA, Quackenbush J, Schriml LM, Kanapin A, Matsuda H, Batalov S, Beisel KW, Blake JA, Bradt D, Brusic V, Chothia C, Corbani LE, Cousins S, Dalla E, Dragani TA, Fletcher CF, Forrest A, Frazer KS, Gaasterland T, Gariboldi M, Gissi C, Godzik A, Gough J, Grimmond S, Gustincich S, Hirokawa N, Jackson IJ, Jarvis ED, Kanai A, Kawaji H, Kawasawa Y, Kedzierski RM, King BL, Konagaya A, Kurochkin IV, Lee Y, Lenhard B, Lyons PA, Maglott DR, Maltais L, Marchionni L, McKenzie L, Miki H, Nagashima T, Numata K, Okido T, Pavan WJ, Pertea G, Pesole G, Petrovsky N, Pillai R, Pontius JU, Qi D, Ramachandran S, Ravasi T, Reed JC, Reed DJ, Reid J, Ring BZ, Ringwald M, Sandelin A, Schneider C, Semple CA, Setou M, Shimada K, Sultana R, Takenaka Y, Taylor MS, Teasdale RD, Tomita M, Verardo R, Wagner L, Wahlestedt C, Wang Y, Watanabe Y, Wells C, Wilming LG, Wynshaw-Boris A, Yanagisawa M, Yang I, Yang L, Yuan Z, Zavolan M, Zhu Y, Zimmer A, Carninci P, Hayatsu N, Hirozane-Kishikawa T, Konno H, Nakamura M, Sakazume N, Sato K, Shiraki T, Waki K, Kawai J, Aizawa K, Arakawa T, Fukuda S, Hara A, Hashizume W, Imotani K, Ishii Y, Itoh M, Kagawa I, Miyazaki A, Sakai K, Sasaki D, Shibata K, Shinagawa A, Yasunishi A, Yoshino M, Waterston R, Lander ES, Rogers J, Birney E, Hayashizaki Y. Analysis of the mouse transcriptome based on functional annotation of 60,770 full-length cDNAs. Nature. 2002;420:563–573. doi: 10.1038/nature01266. - DOI - PubMed
-
- Yelin R, Dahary D, Sorek R, Levanon EY, Goldstein O, Shoshan A, Diber A, Biton S, Tamir Y, Khosravi R, Nemzer S, Pinner E, Walach S, Bernstein J, Savitsky K, Rotman G. Widespread occurrence of antisense transcription in the human genome. Nat Biotechnol. 2003;21:379–386. doi: 10.1038/nbt808. - DOI - PubMed
Publication types
MeSH terms
Substances
LinkOut - more resources
Full Text Sources
Miscellaneous

