. 2005 Jul;29(3):436-52.
doi: 10.1016/j.mcn.2005.03.013.

Ontogeny of postsynaptic density proteins at glutamatergic synapses

Affiliations

Ontogeny of postsynaptic density proteins at glutamatergic synapses

Ronald S Petralia et al. Mol Cell Neurosci. 2005 Jul.

Abstract

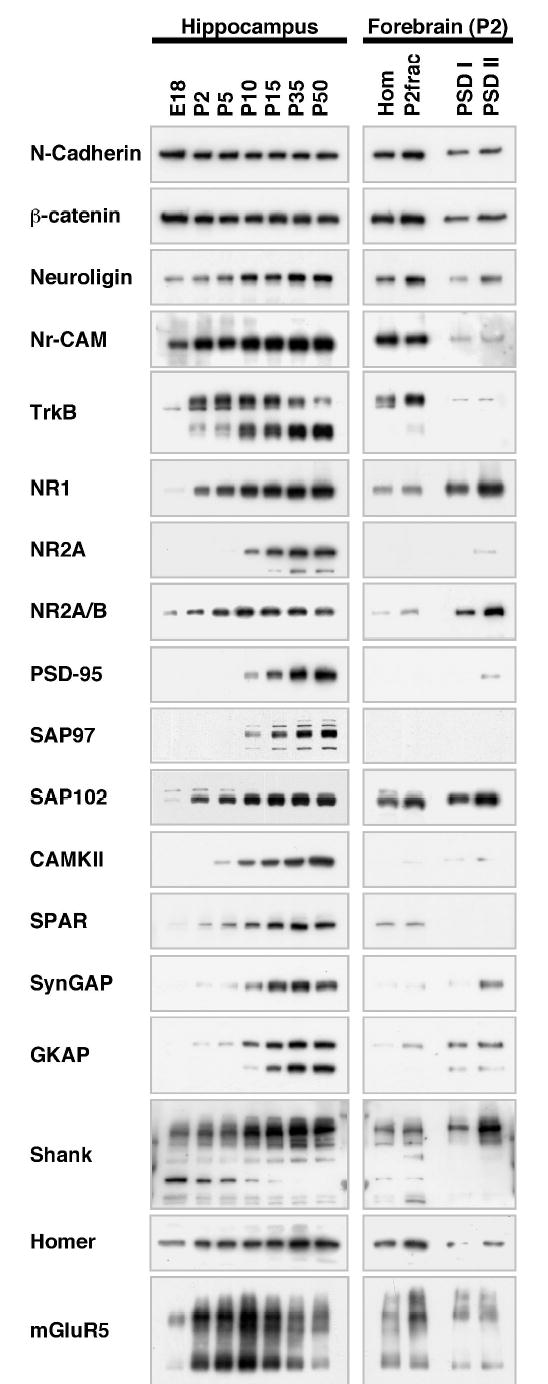
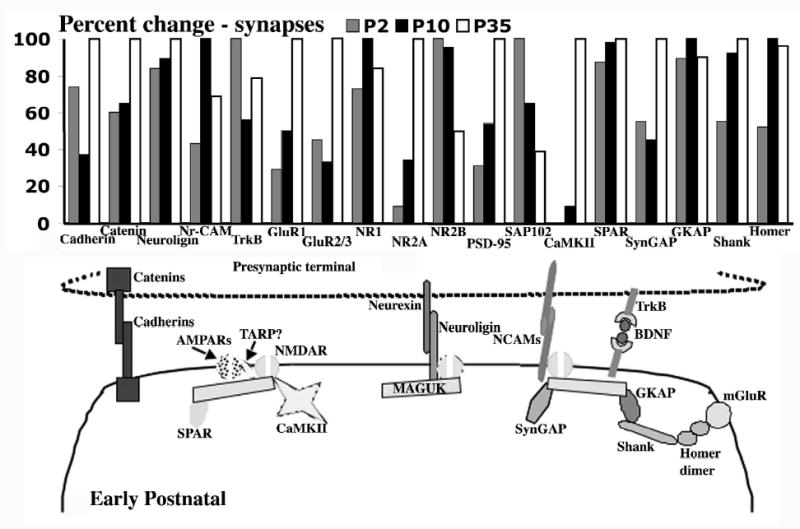
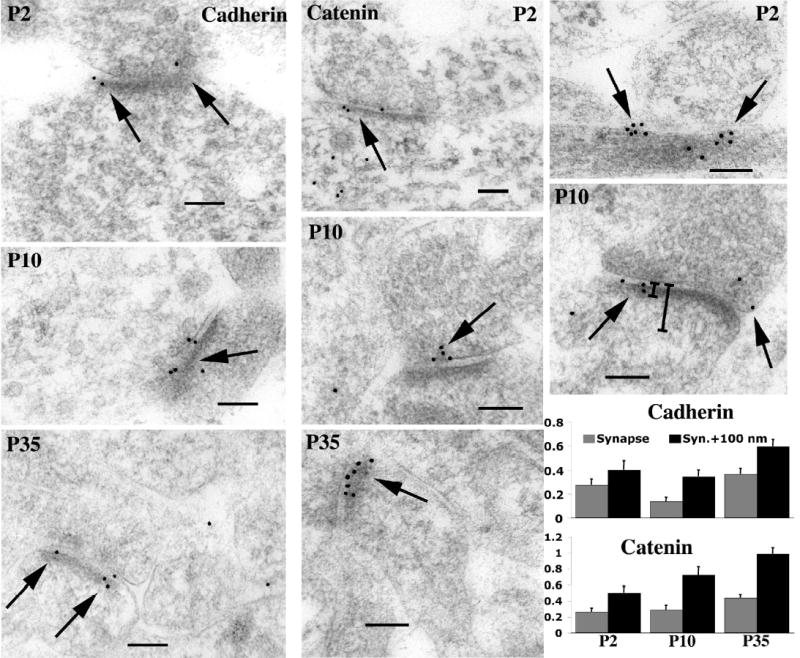
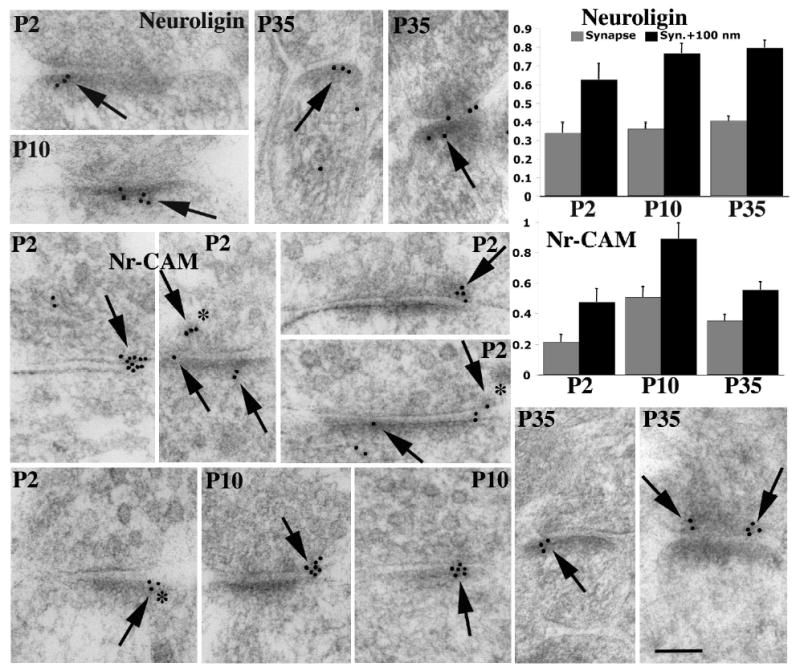
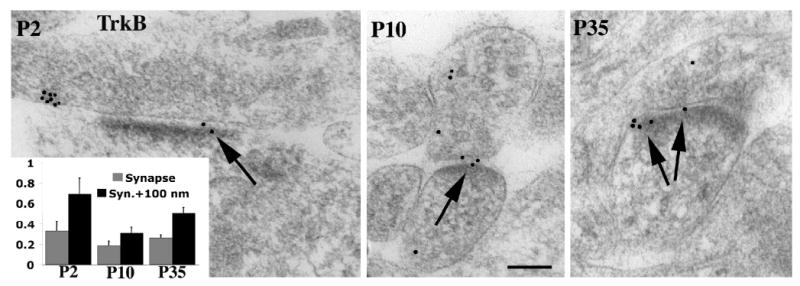
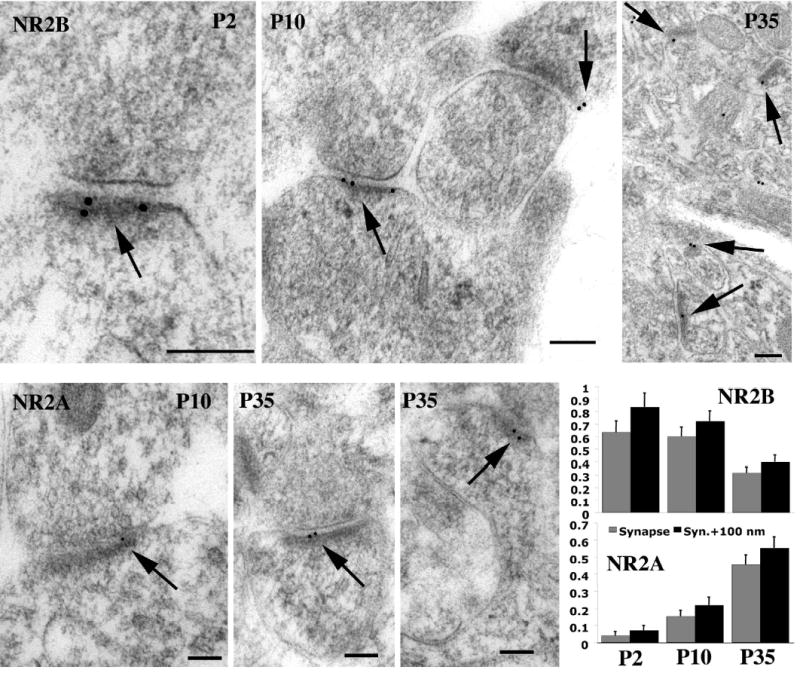
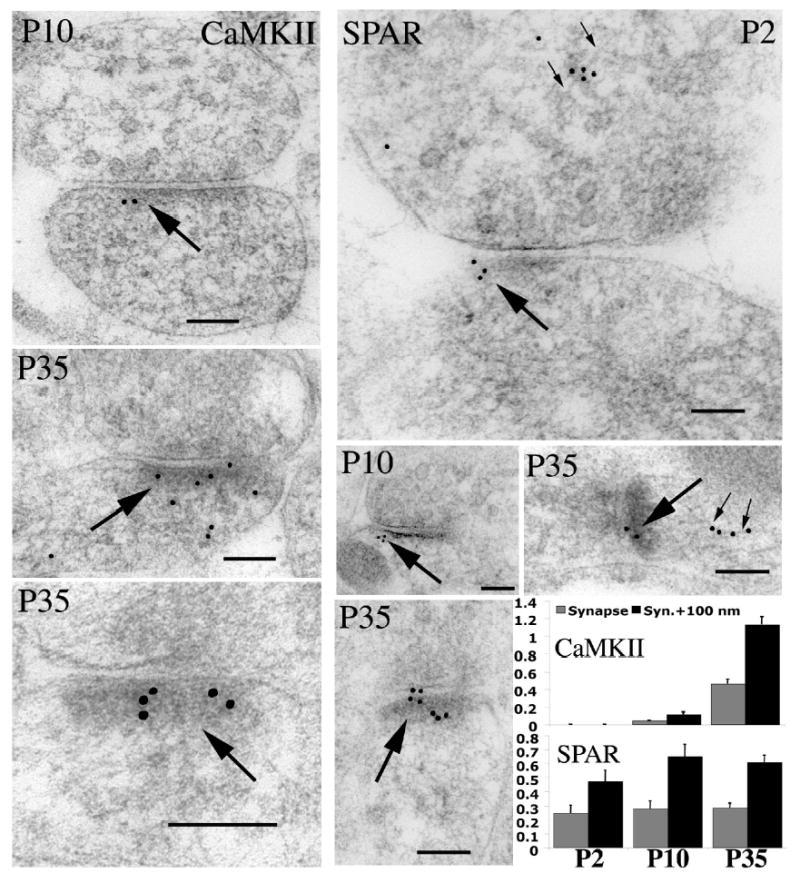
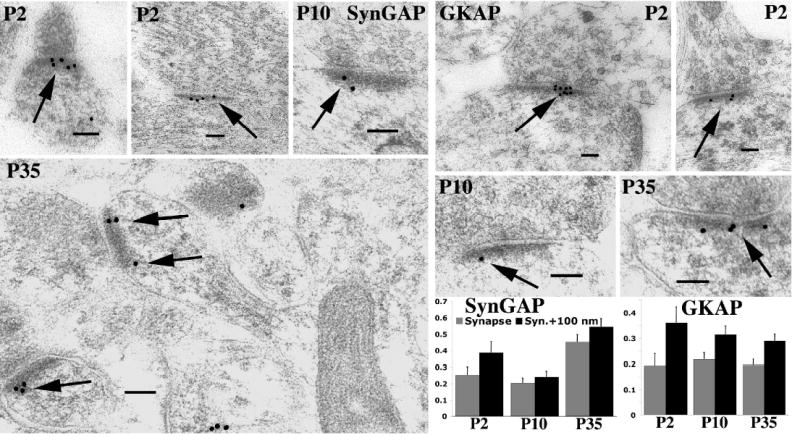
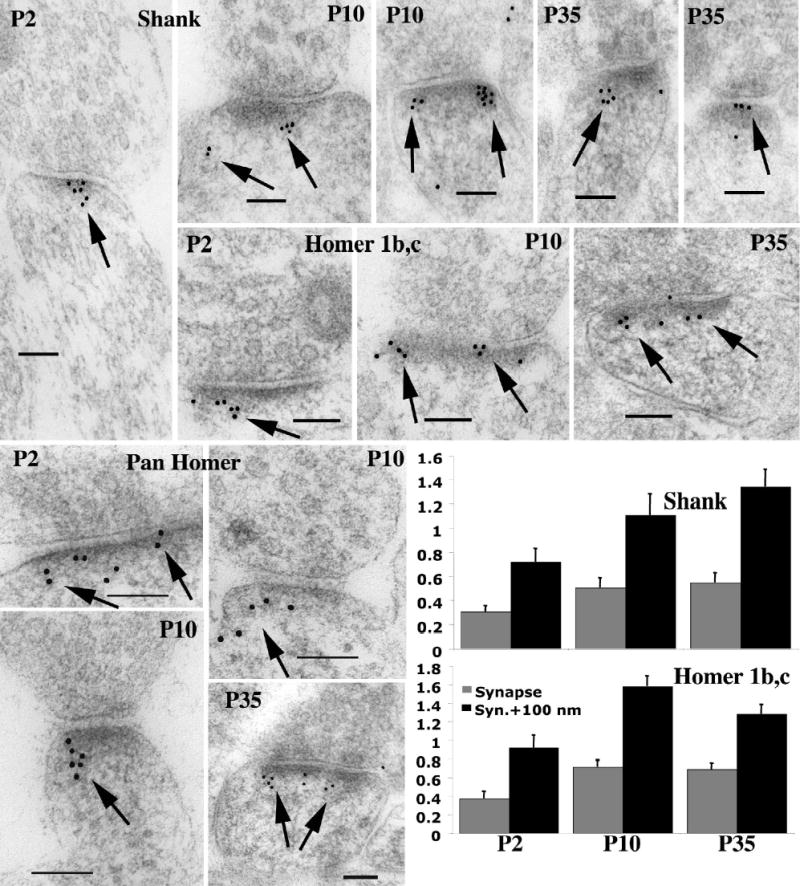
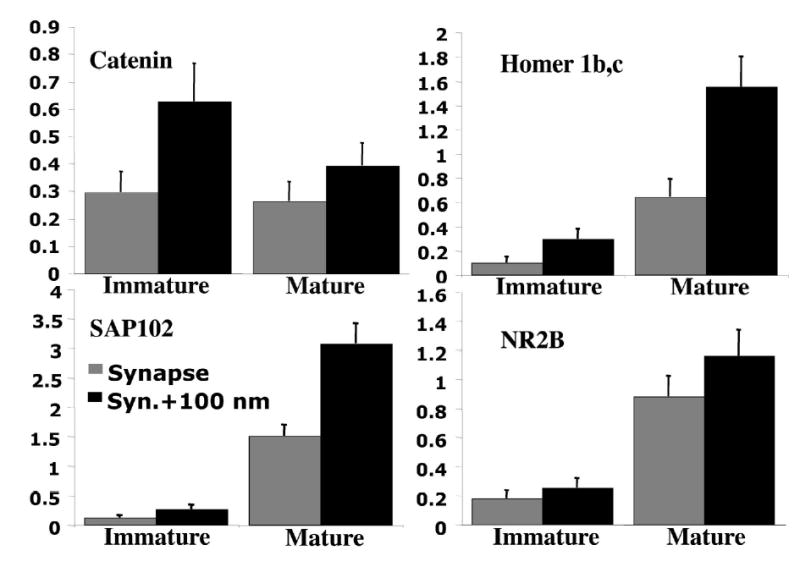
In glutamatergic synapses, glutamate receptors (GluRs) associate with many other proteins involved in scaffolding and signal transduction. The ontogeny of these postsynaptic density (PSD) proteins involves changes in their composition during development, paralleling changes in GluR type and function. In the CA1 region of the hippocampus, at postnatal day 2 (P2), many synapses already have a distinct PSD. We used immunoblot analysis, subcellular fractionation, and quantitative immunogold electron microscopy to examine the distribution of PSD proteins during development of the hippocampus. Synapses at P2 contained substantial levels of NR1 and NR2B and most GluR-associated proteins, including SAP102, SynGAP, the chain of proteins from GluRs/SAP102 through GKAP/Shank/Homer and metabotropic glutamate receptors, and the adhesion factors, cadherin, catenin, neuroligin, and Nr-CAM. Development was marked by substantial decreases in NR2B and SAP102 and increases in NR2A, PSD-95, AMPA receptors, and CaMKII. Other components showed more moderate changes.


Figures

Figure 1
Figure 1
Immunoblots of proteins during the development of the hippocampus from embryonic day 18 (E18) and postnatal days 2 to 50 (P2-P50) and in isolated postsynaptic density (PSD) fractions from rat brains. PSD II represents the final PSD isolate. The same amount of protein was applied to all lanes. Hom, homogenate; P2frac, P2 fraction. Proteins are listed in the same order as used for the description of the immunogold Results, and include: intercellular adhesion proteins, TrkB, glutamate receptors and MAGUKs, proteins associated directly with these, and the Shank-Homer-mGluR5 chain.
Figure 2
Figure 2
Histogram and diagram showing major changes in proteins in synapse development. The Y-axis of the histogram shows gold per synapse (expressed as percent of the highest value per antibody) for antibodies used in this study, as defined in the Methods. Detailed data for each antibody study are included in supplementary Tables 1 and 2. In addition, percentages based on previously published values for GluR1, GluR2/3, NR1 and PSD-95 (published in Petralia et al, 1999 and Sans et al., 2000) are included for comparison. Note the large increase in NR2A (compare to the published data for PSD-95 and AMPA receptors) and CaMKII and decrease in NR2B and SAP102 with age (all highly significant at p≤0.001), while there is no significant change in some such as GKAP and SPAR. Other proteins change more modestly with age and include an increase in cadherin, catenin, neuroligin, SynGAP, Shank and Homer. Diagram illustrates a hypothetical synapse at P2. Note that mature-appearing synapses at P2 contain most major component proteins of the PSD. The light color of AMPARs and CaMKII indicate their low density at this age. TARPs, which may bind AMPARs to MAGUKs, are not discussed in this paper. Not evident in this diagram are profound changes in MAGUKs and NMDA receptor types that occur during further postnatal development (evident in the histogram above); also not illustrated are the earlier stages in synaptogenesis when the only major proteins at the contact may be intercellular adhesion proteins (see text for details; this diagram is based partially on a diagram in the review of Wenthold et al., 2003, and has been modified extensively for the present study).
Figure 3
Figure 3
Immunogold labeling for cadherin and catenin in synapses during postnatal development of hippocampus CA1 stratum radiatum. Both were moderately high at all ages and showed a significant increase in labeling from P10 to P35. For cadherin, 28%, 21%, and 36% of synapses (postsynaptic (synapse+100 nm)) were labeled for P2, P10, and P35, respectively. For catenin, 26%, 33%, 41% of synapses (postsynaptic (synapse+100 nm)) were labeled for P2, P10, P35, respectively. The Y-axis indicates gold per synapse or per synapse+100 nm (postsynaptic), as defined in the Methods. Scale bars for micrographs are 100 nm, arrows in micrographs indicate gold labeling associated with the PSD (or presynaptic active zone), and histograms show values plus standard errors. Vertical bars on one synapse on the right illustrate the vertical distances included in the categories of “synapse” and “synapse+100 nm”, as defined in the text.
Figure 4
Figure 4
Immunogold labeling for neuroligin and Nr-CAM in synapses during postnatal development of hippocampus CA1 stratum radiatum. Both neuroligin and Nr-CAM were moderately high at all ages; there were no significant changes between ages for neuroligin and there was an increase in Nr-CAM from P2 to P10. For neuroligin, 37%, 44%, 48% of synapses (postsynaptic (synapse+100 nm)) were labeled for P2, P10, P35, respectively. For Nr-CAM, 24%, 42%, 32% of synapses (postsynaptic (synapse+100 nm)) were labeled for P2, P10, P35, respectively. Histograms are for neuroligin (top) and Nr-CAM (bottom). The Y-axis indicates gold per synapse or per synapse+100 nm (postsynaptic), as defined in the Methods. Scale bars for micrographs are 100 nm, arrows in micrographs indicate gold labeling associated with the PSD (or presynaptic active zone), and histograms show values plus standard errors. Asterisks indicate gold associated with possible exocytotic pits.
Figure 5
Figure 5
Immunogold labeling for TrkB in synapses during postnatal development of hippocampus CA1 stratum radiatum. There were significant changes in postsynaptic labeling from P2 to P10 (decrease for synapse+100 nm; see Methods) and P10 to P35 (increase for synapse+100 nm). There were 30%, 17%, and 27% of synapses (postsynaptic (synapse+100 nm)) labeled for P2, P10, and P35, respectively. The Y-axis indicates gold per synapse or per synapse+100 nm (postsynaptic), as defined in the Methods. Scale bars for micrographs are 100 nm, arrows in micrographs indicate gold labeling associated with the PSD, and histograms show values plus standard errors.
Figure 6
Figure 6
Immunogold labeling for NR2A and NR2B in synapses during postnatal development of hippocampus CA1 stratum radiatum. Micrographs illustrate the decrease in NR2B and increase in NR2A at synapses during development. For NR2B, there was a significant decrease from P2 to P35 and from P10 to P35; 30%, 33%, and 23% of synapses were labeled for P2, P10, and P35, respectively. For NR2A, there was a significant increase from P2 to P10 and P10 to P35; 3%, 11%, and 29% of synapses were labeled for P2, P10, and P35, respectively. The Y-axis indicates gold per synapse or per synapse+100 nm as defined in the Methods. Scale bars for micrographs are 100 nm, arrows in micrographs indicate gold labeling associated with the PSD, and histograms show values plus standard errors.
Figure 7
Figure 7
Immunogold labeling for CaMKII and SPAR in synapses during postnatal development of hippocampus CA1 stratum radiatum. For CaMKII, note labeling within and subjacent to density. There was no synaptic labeling at P2, and a significant increase from P10 to P35. For synapse+100 nm (see Methods for details), 9% and 55% of synapses were labeled at P10 and P35, respectively. For SPAR, gold labeling was moderate at synapses at all ages; there were no significant differences between ages. For synapse+100 nm, 29%, 33%, and 31% of synapses were labeled at P2, P10, and P35, respectively. In addition, cytoplasmic labeling often was associated with <10 nm filaments (small arrows; presumably actin). The Y-axis indicates gold per synapse or per synapse+100 nm as defined in the Methods. Scale bars for micrographs are 100 nm, arrows in micrographs indicate gold labeling associated with the PSD, and histograms show values plus standard errors.
Figure 8
Figure 8
Immunogold labeling for SynGAP and GKAP in synapses during postnatal development of hippocampus CA1 stratum radiatum. For SynGAP, gold labeling was moderately prevalent at all ages, and increased significantly from P10 to P35. Upper left micrograph (P2) is from the ABR SynGAP antibody, which was not used for quantification; other micrographs are from the quantitative studies using the Huganir SynGAP antibody. For synapse+100 nm, 19%, 18%, and 30% of synapses were labeled for P2, P10, and P35, respectively. For GKAP-C labeling, there were no significant changes with age. For synapse+100 nm, 20%, 21%, and 19% of synapses were labeled for P2, P10, and P35, respectively. The Y-axis indicates gold per synapse or per synapse+100 nm as defined in the Methods. Scale bars for micrographs are 100 nm, arrows in micrographs indicate gold labeling associated with the PSD, and histograms show values plus standard errors.
Figure 9
Figure 9
Immunogold labeling for Shank and Homer (1b,c and pan antibodies) in synapses during postnatal development of hippocampus CA1 stratum radiatum. Shank and Homer showed similar patterns with each other at all ages, with labeling prevalent both in the PSD and subjacent to it. There was a significant increase in Shank from P2 to P35 and in Homer 1b,c from P2 to P10. For Shank, 33%, 41%, and 52% of synapses (synapse+100 nm) were labeled for P2, P10, and P35, respectively. For Homer 1b,c, 44%, 71%, and 61% of synapses (synapse+100 nm) were labeled for P2, P10, and P35, respectively. The Y-axis indicates gold per synapse or per synapse+100 nm as defined in the Methods. Scale bars for micrographs are 100 nm, arrows in micrographs indicate gold labeling associated with the PSD, and histograms show values plus standard errors.
Figure 10
Figure 10
Comparison of immunogold labeling in immature versus mature synaptic contacts at P2 in hippocampus CA1 stratum radiatum. Immature synapses included here lacked a substantial PSD (for details, see Results). Note that there was no significant change in catenin labeling, while there was a highly significant increase (p≤0.001) in labeling for NR2B, SAP102, and Homer 1b,c. The Y-axis indicates gold per synapse or per synapse+100 nm as defined in the Methods (values plus standard errors).

Similar articles

Cited by

References

    1. Ahmari SE, Buchanan J, Smith SJ. Assembly of presynaptic active zones from cytoplasmic transport packets. Nat Neurosci. 2000;3:445–451. - PubMed
    1. Alberts P, Galli T. The cell outgrowth secretory endosome (COSE): a specialized compartment involved in neuronal morphogenesis. Biol Cell. 2003;95:419–424. - PubMed
    1. Ango F, de Cristo G, Higashiyama H, Bennett V, Wu P, Huang ZJ. Ankyrin-based subcellular gradient of neurofascin, an immunoglobulin family protein, directs GABAergic innervation at Purkinje axon initial segment. Cell. 2004;119:257–272. - PubMed
    1. Aoki C, Wu K, Elste A, Len GW, Lin SY, McAuliffe G, Black IB. Localization of brain-derived neurotrophic factor and TrkB receptors to postsynaptic densities of adult rat cerebral cortex. J Neurosci Res. 2000;59:454–463. - PubMed
    1. Appel F, Holm J, Conscience J, von Bohlen und Halbach F, Faissner A, James P, Schachner M. Identification of the border between fibronectin type III homologous repeats 2 and 3 of the neural cell adhesion molecule L1 as a neurite outgrowth promoting and signal-transducing domain. J Neurobiol. 1995;28:297–312. - PubMed

MeSH terms