Quaternary structures of intermediately ligated human hemoglobin a and influences from strong allosteric effectors: resonance Raman investigation
- PMID: 15894633
- PMCID: PMC1366605
- DOI: 10.1529/biophysj.104.049775
Quaternary structures of intermediately ligated human hemoglobin a and influences from strong allosteric effectors: resonance Raman investigation
Abstract
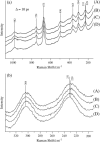
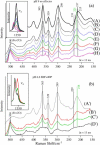
The Fe-histidine stretching (nu(Fe-His)) frequency was determined for deoxy subunits of intermediately ligated human hemoglobin A in equilibrium and CO-photodissociated picosecond transient species in the presence and absence of strong allosteric effectors like inositol(hexakis)phosphate, bezafibrate, and 2,3-bisphosphoglycerate. The nu(Fe-His) frequency of deoxyHb A was unaltered by the effectors. The T-to-R transition occurred around m = 2-3 in the absence of effectors but m > 3.5 in their presence, where m is the average number of ligands bound to Hb and was determined from the intensity of the nu(4) band measured in the same experiment. The alpha1-beta2 subunit contacts revealed by ultraviolet resonance Raman spectra, which were distinctly different between the T and R states, remained unchanged by the effectors. This observation would solve the recent discrepancy that the strong effectors remove the cooperativity of oxygen binding in the low-affinity limit, whereas the (1)H NMR spectrum of fully ligated form exhibits the pattern of the R state.
Figures


Similar articles
-
T-quaternary structure of oxy human adult hemoglobin in the presence of two allosteric effectors, L35 and IHP.Biochim Biophys Acta. 2011 Oct;1807(10):1253-61. doi: 10.1016/j.bbabio.2011.06.004. Epub 2011 Jun 15. Biochim Biophys Acta. 2011. PMID: 21703224
-
A possible allosteric communication pathway identified through a resonance Raman study of four beta37 mutants of human hemoglobin A.Biochemistry. 1998 Mar 31;37(13):4346-57. doi: 10.1021/bi9708693. Biochemistry. 1998. PMID: 9521755
-
Semihemoglobins, high oxygen affinity dimeric forms of human hemoglobin respond efficiently to allosteric effectors without forming tetramers.J Biol Chem. 2004 Nov 19;279(47):48959-67. doi: 10.1074/jbc.M405909200. Epub 2004 Sep 10. J Biol Chem. 2004. PMID: 15361521
-
Spectroscopic and functional characterization of T state hemoglobin conformations encapsulated in silica gels.Biochemistry. 2004 Nov 2;43(43):13674-82. doi: 10.1021/bi048531d. Biochemistry. 2004. PMID: 15504030
-
Ultraviolet resonance Raman studies of quaternary structure of hemoglobin using a tryptophan beta 37 mutant.J Biol Chem. 1995 Jan 27;270(4):1636-42. doi: 10.1074/jbc.270.4.1636. J Biol Chem. 1995. PMID: 7829496
Cited by
-
Solution structure and dynamics of human hemoglobin in the carbonmonoxy form.Biochemistry. 2013 Aug 27;52(34):5809-20. doi: 10.1021/bi4005683. Epub 2013 Aug 15. Biochemistry. 2013. PMID: 23901897 Free PMC article.
-
Effects of allosteric effectors on oxygen binding to crystals of hemoglobin in the R-quaternary structure.Protein Sci. 2025 Jan;34(1):e5232. doi: 10.1002/pro.5232. Protein Sci. 2025. PMID: 39660833 Free PMC article.
-
Deep-UV biological imaging by lanthanide ion molecular protection.Biomed Opt Express. 2015 Dec 18;7(1):158-70. doi: 10.1364/BOE.7.000158. eCollection 2016 Jan 1. Biomed Opt Express. 2015. PMID: 26819825 Free PMC article.
-
Structural origin of cooperativity in human hemoglobin: a view from different roles of α and β subunits in the α2β2 tetramer.Biophys Rev. 2022 Apr 18;14(2):483-498. doi: 10.1007/s12551-022-00945-7. eCollection 2022 Apr. Biophys Rev. 2022. PMID: 35528033 Free PMC article. Review.
-
An investigation of the distal histidyl hydrogen bonds in oxyhemoglobin: effects of temperature, pH, and inositol hexaphosphate.Biochemistry. 2010 Dec 21;49(50):10606-15. doi: 10.1021/bi100927p. Epub 2010 Nov 29. Biochemistry. 2010. PMID: 21077639 Free PMC article.
References
-
- Monod, J., J. Wyman, and J. P. Changeux. 1965. On the nature of allosteric transition: a plausible model. J. Mol. Biol. 12:88–118. - PubMed
-
- Perutz, M. F. 1970. Stereochemistry of cooperative effects in haemoglobin. Nature. 228:726–739. - PubMed
-
- Perutz, M. F. 1979. Regulation of oxygen affinity of hemoglobin: influence of structure of the globin on the heme iron. Annu. Rev. Biochem. 48:327–386. - PubMed
-
- Perutz, M. F., G. Fermi, B. Luisi, B. Shaanan, and R. C. Liddington. 1987. Stereochemistry of cooperative mechanisms in hemoglobin. Acc. Chem. Res. 20:309–321. - PubMed
-
- Perutz, M. F. 1990. Mechanisms regulating the reactions of human hemoglobin with oxygen and carbon monoxide. Annu. Rev. Physiol. 52:1–25. - PubMed
Publication types
MeSH terms
Substances
Grants and funding
LinkOut - more resources
Full Text Sources
Research Materials

