

Soybean genotypic difference in growth, nutrient accumulation and ultrastructure in response to manganese and iron supply in solution culture
- PMID: 15897206
- PMCID: PMC4246819
- DOI: 10.1093/aob/mci160
Soybean genotypic difference in growth, nutrient accumulation and ultrastructure in response to manganese and iron supply in solution culture
Abstract
Background and aims: The objective of this research was to characterize the physiology and cell ultrastructure of two soybean genotypes subjected to nutrient solutions with increasing concentrations of manganese (Mn) at two contrasting iron (Fe) concentrations. Genotypes 'PI227557' and 'Biloxi' were selected based on their distinctly different capacities to accumulate Mn and Fe. *
Methods: Bradyrhizobium-inoculated plants were grown in hydroponic cultures in a greenhouse. Nutrient solutions were supplied with Mn concentrations ranging from 0.3 to 90 microm, at either 5 or 150 microm Fe as FeEDTA. *
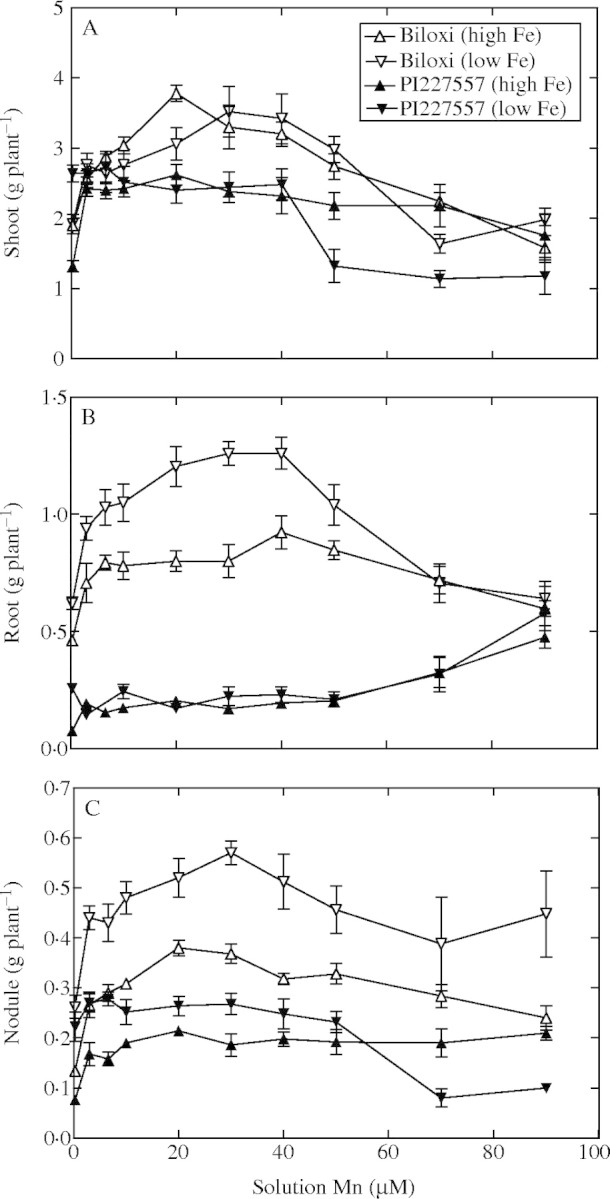
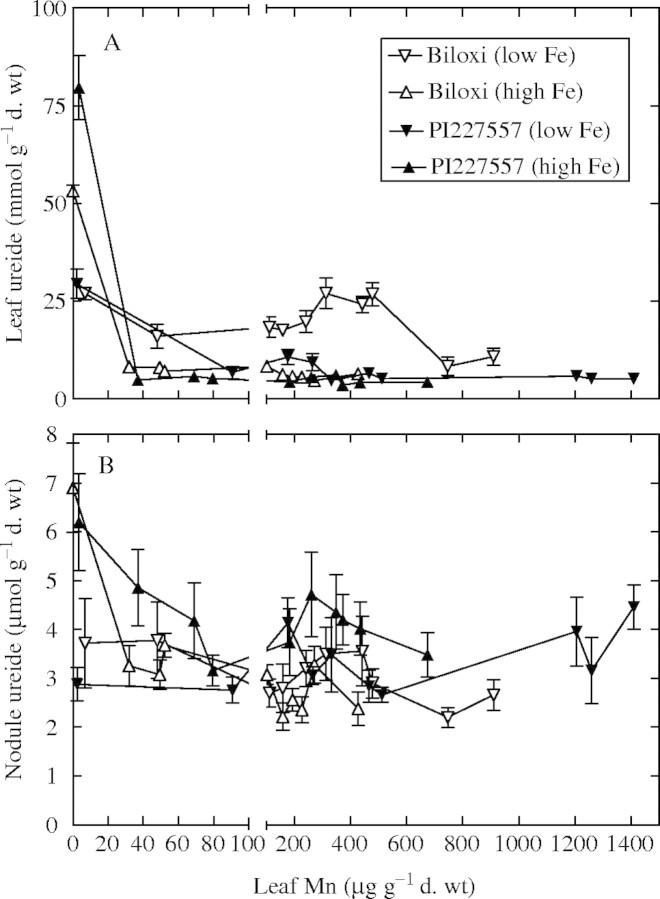
Key results: For both genotypes and at both Fe concentrations, Mn concentrations from 6.6 to 50 microm did not affect shoot, root and nodule mass, or leaf and nodule ureide concentration. Mn concentrations of 70 and 90 microm did not result in visible toxicity symptoms, but hindered growth and nodulation of 'Biloxi'. An Mn concentration of 0.3 microm was, however, deleterious to growth and nodulation for both genotypes, and caused an accumulation of ureides in leaves and major alterations in the ultrastructure of chloroplasts, nuclei and mitochondria, regardless of the Fe concentration. In 'PI227557', there was also a proliferation of Golgi apparatus and endoplasmic reticulum in the cytoplasm of leaf cells, and nodules showed disrupted symbiosomes lacking poly-beta-hydroxybutirate grains concomitantly with a proliferation of endoplasmic reticulum as well as arrested bacterial division. At 15 microm Fe, ferritin-like crystals were formed in the lumen of chloroplasts of 'PI227557' plants. For both genotypes, there was an antagonism between the Fe and Mn concentrations in leaves, the higher values of both microelements being detected in 'PI227557'. The absence of any detectable relationship between Fe or Mn and zinc, phosphorus and copper concentrations in leaves ruled out those micronutrients as relevant for Mn and Fe nutrition in soybeans. *
Conclusions: The results confirmed the greater capacity of 'PI227557' for Mn and Fe accumulation than 'Biloxi' for most nutrient treatments. Hence, 'PI227557' may be a very useful genetic resource both in developing soybean cultivars for growth on low nutrient soils and in physiological studies to understand differing approaches to nutrient accumulation in plants.
Figures


Similar articles
-
Irradiance regulates genotype-specific responses of Rhizobium-nodulated soybean to increasing iron and two manganese concentrations in solution culture.J Plant Physiol. 2009 May 15;166(8):807-18. doi: 10.1016/j.jplph.2008.10.006. Epub 2008 Dec 23. J Plant Physiol. 2009. PMID: 19108931
-
Bioaccumulation and effects of lanthanum on growth and mitotic index in soybean plants.Ecotoxicol Environ Saf. 2015 Dec;122:136-44. doi: 10.1016/j.ecoenv.2015.07.020. Epub 2015 Jul 29. Ecotoxicol Environ Saf. 2015. PMID: 26232040
-
Leaf ureide degradation and N(2) fixation tolerance to water deficit in soybean.J Exp Bot. 2001 Jan;52(354):153-9. J Exp Bot. 2001. PMID: 11181724
-
Manganese (Mn) and iron (Fe): interdependency of transport and regulation.Neurotox Res. 2010 Aug;18(2):124-31. doi: 10.1007/s12640-009-9130-1. Epub 2009 Nov 18. Neurotox Res. 2010. PMID: 19921534 Free PMC article. Review.
-
Removing Mn, Cu and Fe from Real Wastewaters with Macrophytes: Reviewing the Relationship between Environmental Factors and Plants' Uptake Capacity.Toxics. 2023 Feb 7;11(2):158. doi: 10.3390/toxics11020158. Toxics. 2023. PMID: 36851032 Free PMC article. Review.
Cited by
-
Heavy metal stress and some mechanisms of plant defense response.ScientificWorldJournal. 2015;2015:756120. doi: 10.1155/2015/756120. Epub 2015 Jan 26. ScientificWorldJournal. 2015. PMID: 25688377 Free PMC article. Review.
-
Plant ferritin--a source of iron to prevent its deficiency.Nutrients. 2015 Feb 12;7(2):1184-201. doi: 10.3390/nu7021184. Nutrients. 2015. PMID: 25685985 Free PMC article. Review.
-
Manganese phytotoxicity: new light on an old problem.Ann Bot. 2015 Sep;116(3):313-9. doi: 10.1093/aob/mcv111. Ann Bot. 2015. PMID: 26311708 Free PMC article. Review.
-
Overexpression of RsMYB1 Enhances Anthocyanin Accumulation and Heavy Metal Stress Tolerance in Transgenic Petunia.Front Plant Sci. 2018 Sep 20;9:1388. doi: 10.3389/fpls.2018.01388. eCollection 2018. Front Plant Sci. 2018. PMID: 30294338 Free PMC article.
-
Protective effect of Mn(III)-desferrioxamine B upon oxidative stress caused by ozone and acid rain in the Brazilian soybean cultivar Glycine max "Sambaiba".Environ Sci Pollut Res Int. 2015 Apr;22(7):5315-24. doi: 10.1007/s11356-014-3951-z. Epub 2014 Dec 17. Environ Sci Pollut Res Int. 2015. PMID: 25510614
References
-
- Abdelmajid K, Chedly A. 2003. Importance of iron use-efficiency of nodules in common bean (Phaseolus vulgaris L.) for iron deficiency chlorosis resistance. Journal of Plant Nutrition and Soil Science 166: 525–528.
-
- Adams ML, Norvell WA, Philpot WD, Peverly JH. 2000. Spectral detection of micronutrient deficiency in ‘Bragg’ soybean. Agronomy Journal 92: 261–268.
-
- Alam S, Kamei S, Kawai S. 2001. Amelioration of manganese toxicity in barley with iron. Journal of Plant Nutrition 24: 1421–1433.
-
- Becker R, Manteuffel R, Neumann D, Scholz G. 1998. Excessive iron accumulation in the pea nutants dgl and brz: subcellular localization of iron and ferritin. Planta 207: 217–223.
-
- Ciamporova M, Trginova I. 1999. Modifications of plant cell ultrastructure accompanying metabolic responses to low temperature. Biologia 54: 349–360.
Publication types
MeSH terms
Substances
LinkOut - more resources
Full Text Sources
Medical
