. 2005 May 16;201(10):1555-65.
doi: 10.1084/jem.20042521.

Antigen persistence is required throughout the expansion phase of a CD4(+) T cell response

Affiliations

Antigen persistence is required throughout the expansion phase of a CD4(+) T cell response

Reinhard Obst et al. J Exp Med. .

Abstract

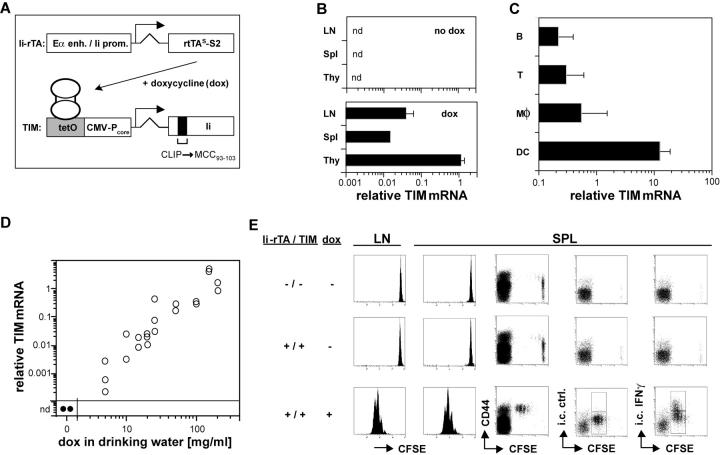
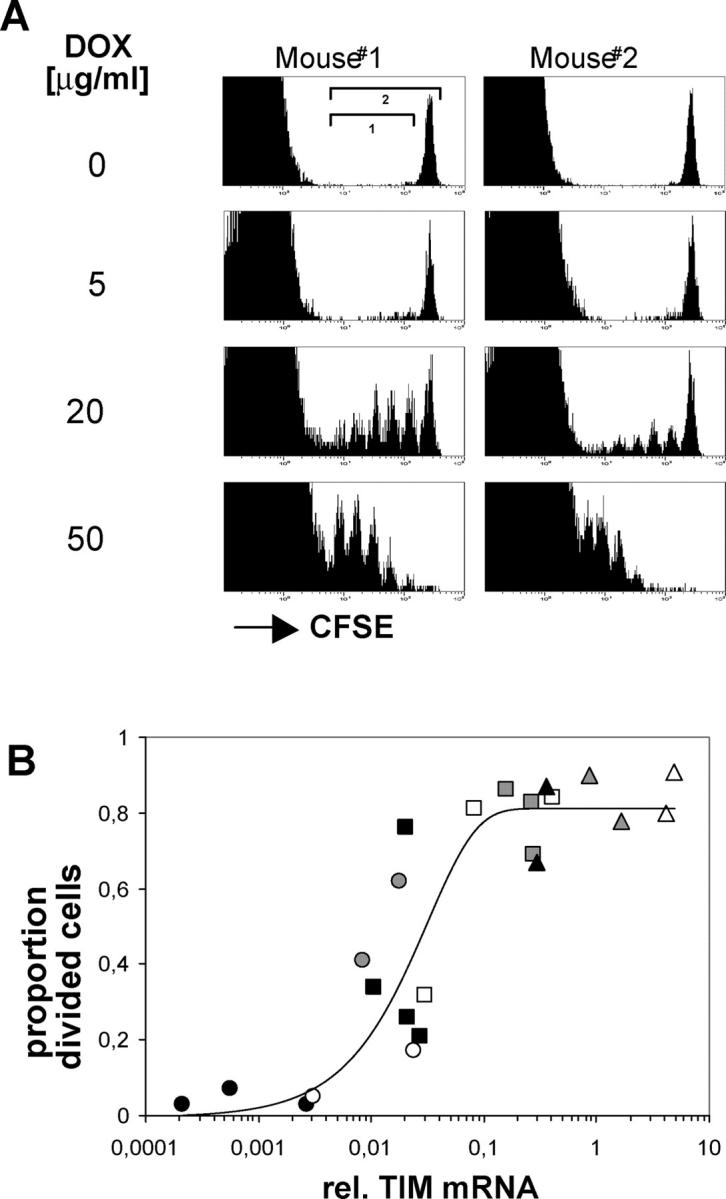
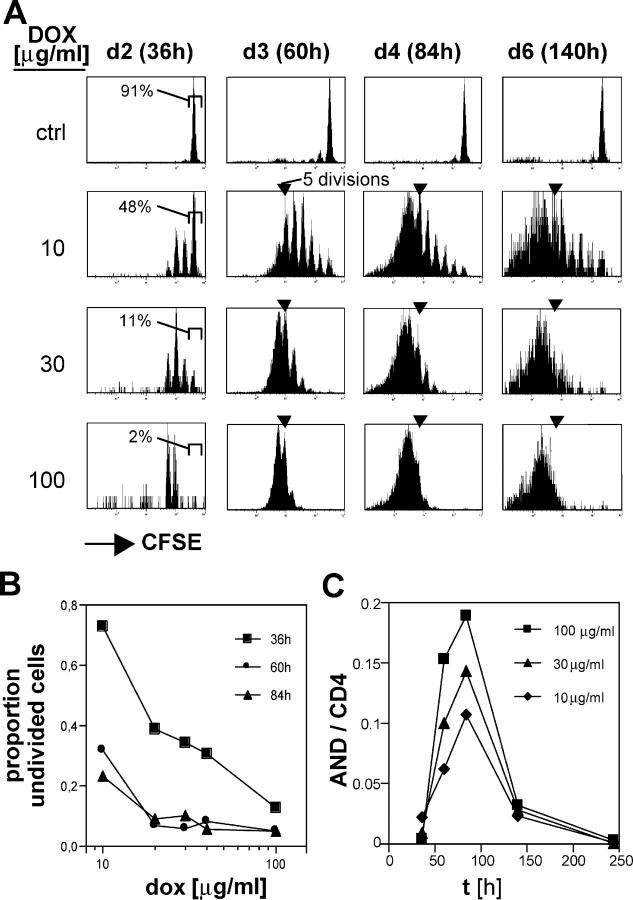
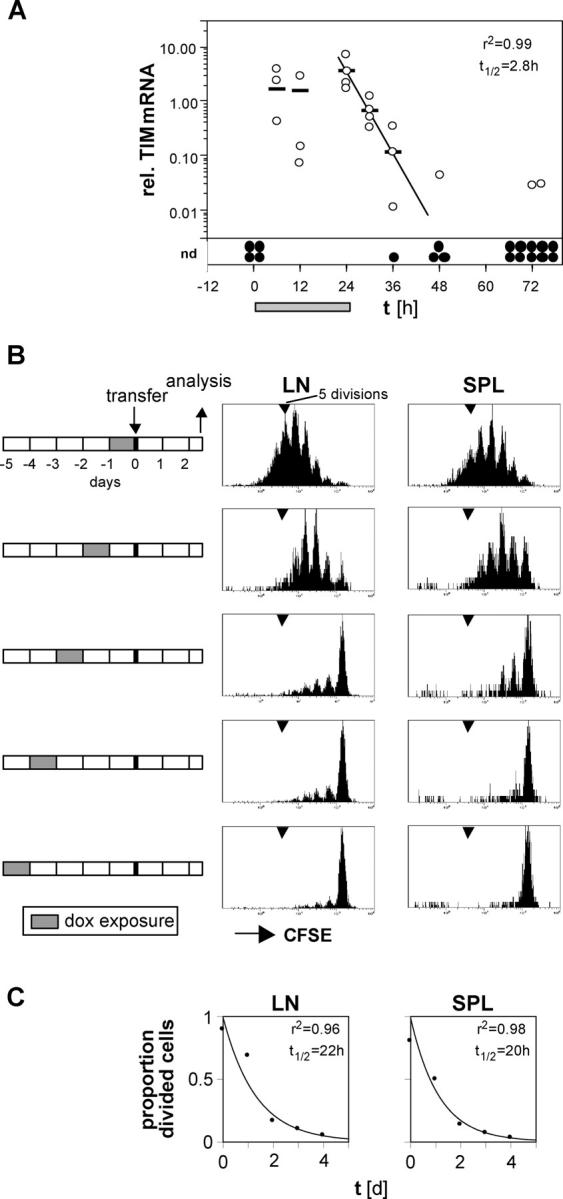
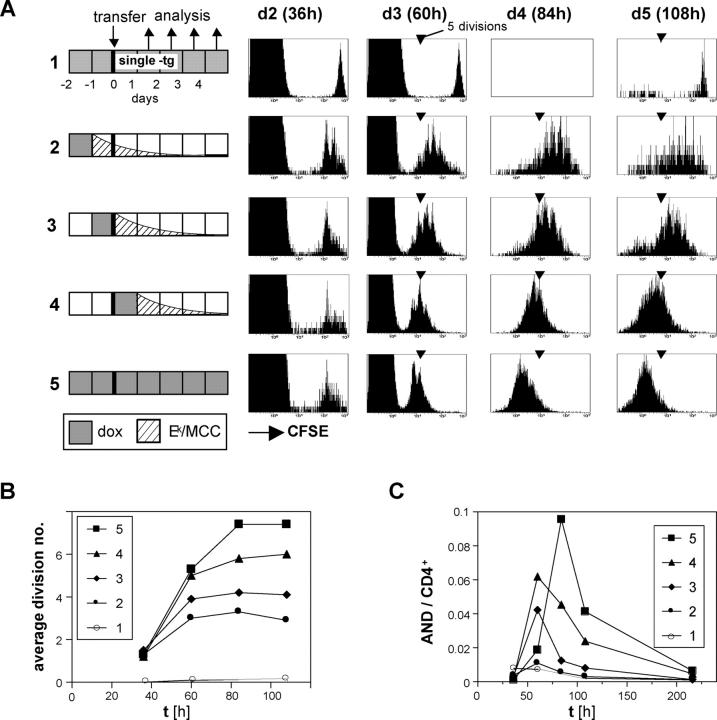
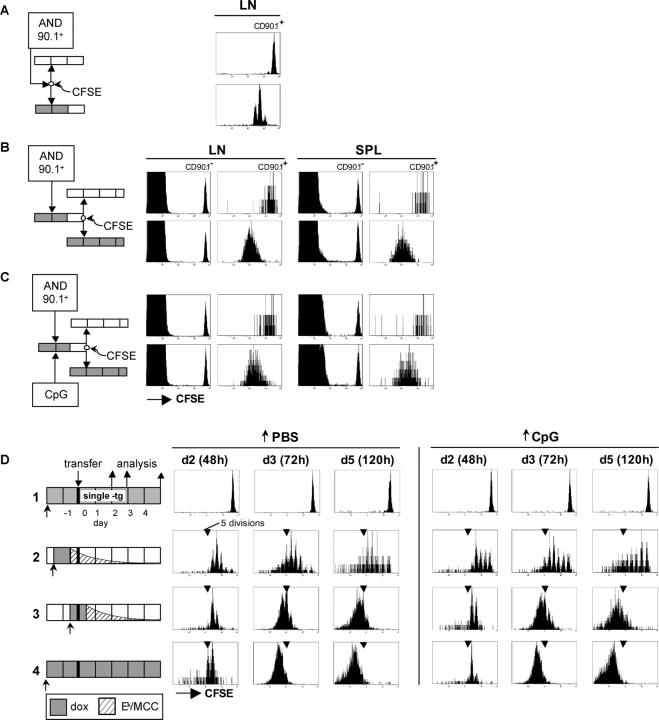
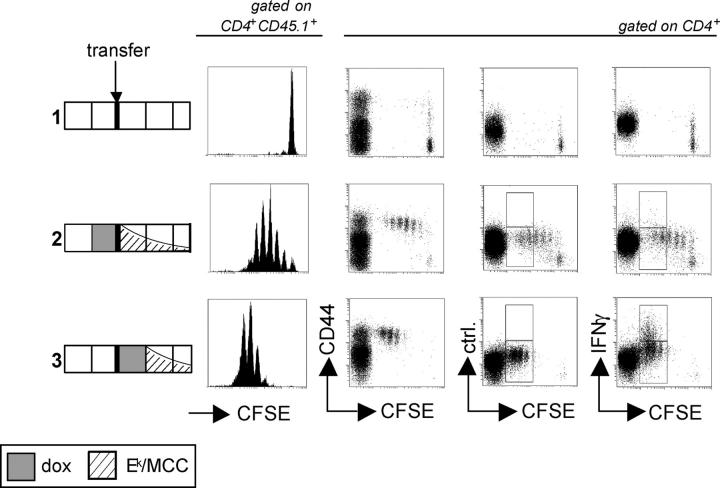
For CD8(+) T cells, a relatively short antigen pulse seems sufficient for antigen-presenting cells to drive clonal expansion and differentiation. It is unknown whether the requirement for antigen is similarly ephemeral for CD4(+) T cells. To study the dependence of a CD4(+) T cell response on antigen persistence in a quantitatively and temporally controlled manner in vivo, we engineered a mouse line expressing a major histocompatibility complex class II-restricted epitope in dendritic cells under the control of a tetracycline-inducible promoter. Experiments tracking the proliferation of CD4(+) T cells exposed to their cognate antigen in various amounts for different time periods revealed that the division of such cells was contingent on the presence of antigen throughout their expansion phase, even in the presence of an inflammatory stimulus. This previously unrecognized feature of a CD4(+) T cell response contrasts with the proliferative behavior of CD8(+) T cells that has been documented, and it implies that the two T cell subsets might require different strategies for efficient vaccination.


Figures

Figure 1.
Figure 1.
dox-controlled expression of a T cell epitope in vivo. (A) Schematic view of the double transgenic system. See the first two paragraphs of Results for details. (B) dox-dependent TIM reporter gene expression in lymphoid tissues. mRNA from the lymph nodes, spleen, and thymus of Ii-rTA+TIM+ animals supplied with standard (top) or 100 μg/ml dox-containing (bottom) drinking water was prepared, and TIM mRNA expression was assessed relative to HPRT by real-time RT-PCR. Data are from two and three animals, respectively (nd, not detectable). (C) In the spleen, the TIM reporter gene was mostly expressed in DCs. Splenocytes were sorted with mAbs against CD19, CD3, CD11b, and CD11c. cDNA was prepared, and TIM expression levels were determined by real-time RT-PCR and normalized to HPRT. Data from three animals are shown. The experiment was repeated twice with similar results. (D) TIM reporter mRNA quantitatively regulated by dox in the drinking water. Ii-rTA+TIM+ animals were exposed to the indicated doses of dox for 3 d, mRNA was prepared from subcutaneous lymph nodes, and TIM mRNA expression was assessed by real-time RT-PCR. Shown are values normalized to Ii-rTA mRNA. Each symbol represents a sample from one animal. The data were compiled from three independent experiments. (E) On transfer, AND CD4+ T cells proliferated in Ii-rTA+TIM+ recipients only in the presence of dox. Lymph node cells from AND+CD90.1+ animals were CFSE labeled and transferred into CD90.1 recipients of the indicated genotypes that were treated with 100 μg/ml dox as indicated, and subcutaneous lymph nodes and spleens were analyzed 60 h later. The histograms are gated on CD4+CD90.1+ cells, all other panels are gated on CD4+ cells. The experiment was repeated with similar results.
Figure 2.
Figure 2.
T cell responses vary with antigen dose. (A) Lymph node cells from AND TCR transgenic mice were CFSE labeled and transferred into two double transgenic Ii-rTA+TIM+ recipients that were exposed throughout the experiment to drinking water containing dox at the indicated concentrations. Lymph node cells were analyzed 60 h later. The plots are gated on CD4+ cells. (B) T cell activation threshold in vivo. Lymph nodes from the animals described in A were also analyzed for Ii-rtTA and TIM mRNAs by quantitative RT-PCR. The proportion of divided cells 60 h after transfer was determined by dividing the cell numbers in each peak by 2i, with i being the division number, and dividing this normalized number of divided cells (region 1) by the normalized total (region 2). Each data point stands for one animal, with each symbol representing one dose of dox in the drinking water (closed black circle, 5; open circle, 10; closed gray circle, 15; closed black square, 20; open square, 25; closed gray square, 50; closed black triangle,100; open triangle, 50; closed gray triangle, 200 [μg/ml each]). The data are compiled from three independent experiments.
Figure 3.
Figure 3.
The amount of antigen displayed by DCs determines both the initial induction of CD4+ T cells to proliferate and its rate. (A) At a low antigen dose, some CD4+ cells divided fewer than six times. Lymph node cells from CD90.1+ AND TCR transgenic mice were CFSE labeled and transferred into Ii-rTA+TIM+ animals that were supplied with 10, 30, or 100 μg/ml dox starting 2 d before transfer. The control animal (top) was an animal transgenic for TIM only and was fed with 100 μg/ml dox. Individual subcutaneous lymph nodes were removed 36, 60, 84, and 140 h after the transfer and analyzed by gating on CD4+CD90.1+ cells. Percentages indicate gated cells. (B) Induction of cell division 36 h after transfer correlated with antigen dose. The fraction of undivided cells at each time point after T cell transfer was calculated as described in Fig. 2 B and plotted against the dox dose. (C) Relative cell numbers of antigen-specific cells (CD90.1+) in the CD4+ T cell compartment increased corresponding to the dox dosage. The experiment was repeated with similar results.
Figure 4.
Figure 4.
Half-life of TIM mRNA and Ek–MCC93-103 complexes in vivo. (A) Ii-rTA+TIM+ mice were exposed to 100 μg/ml dox in the drinking water for 24 h (gray bar). Subcutaneous lymph nodes were removed from four animals at each time point (except 12 that were taken at 72 h) and analyzed for TIM expression relative to Ii-rTA mRNA, as described for Figs. 1 and 2 (open circle, lymph node; bars, arithmetic means; closed circles, samples below the detection limit of the quantitative RT-PCR assay). The disappearance of the TIM mRNA within 24 h after dox withdrawal could be modeled by y = 3.0e−0.24x. The experiment was repeated twice with similar results (nd, not detectable). (B) Double transgenic animals were exposed to 100 μg/ml dox in the drinking water for 24 h from 0 to 5 d before the transfer of CFSE-labeled lymph node cells from CD90.1+ AND TCR transgenic mice. 60 h later, subcutaneous lymph nodes and spleen were analyzed. The histograms depict CD4+CD90.1+ cells. The experiment was repeated with similar results. (C) The proportion of divided cells was quantitated from the data shown in B as described for Fig. 2 B, modeled with y = 0.89e−0.75x and y = 0.87e−0.75x for the lymph nodes and spleen, respectively.
Figure 5.
Figure 5.
Continued proliferation of CD4+ T cells depends on antigen persistence. (A) CFSE-labeled lymph node cells from CD45.1+ AND TCR transgenic mice were transferred into mice that were treated with 100 μg/ml dox for 24 h according to the indicated schedules. All recipients were double transgenic Ii-rTA+TIM+, except mouse 1, which carried the TIM gene only and was dox treated throughout. Subcutaneous lymph nodes were removed 36, 60, 84, and 108 h after transfer and were analyzed by flow cytometry. The 36-h and 60-h panels are gated on CD4+ cells, the others on CD4+CD45.1+ cells. One representative experiment out of five independent ones is shown. (B) Mean number of divisions of transferred cells from experiment A plotted against time is shown. (C) Proportion of transferred AND CD4+ cells among total CD4+ cells in subcutaneous lymph nodes from experiment A over time is shown.
Figure 6.
Figure 6.
Primed CD4+ cells require antigen for continued proliferation in a double transfer model and under inflammatory conditions. (A) AND cells divide two to four times in a primary host. CFSE-labeled lymph node cells from CD90.1+ AND TCR transgenic mice were transferred into a double transgenic Ii-rTA+TIM+ recipient pretreated with 100 μg/ml dox. 24 h later, straight water was given. Another 24 h later, CD4+CD90.1+ lymph node cells were analyzed for CFSE dilution. (B) Primed AND T cells require antigen for proliferation in a secondary host. Unlabeled CD90.1+ AND cells were transferred into a double transgenic Ii-rTA+TIM+ primary recipient pretreated with 100 μg/ml dox. 24 h later, straight water was given. Another 24 h later, the lymph node cells were CFSE labeled and transferred into an untreated nontransgenic (top) or a dox-treated Ii-rTA+TIM+ (bottom) secondary host. 60 h later, subcutaneous lymph node cells were analyzed by flow cytometry. CFSE profiles of CD4+CD90.1 cells (left) and CD4+CD90.1+ AND cells (right) are depicted. One representative experiment out of three independent ones is shown. (C) Primed AND T cells require antigen for proliferation in a secondary host even under inflammatory conditions. The experiment was performed as described in B, but 10 nmol of the CpG-containing oligonucleotide 1668 were injected i.p. at the time of the first transfer. (D) Continued proliferation of CD4+ T cells depends on antigen persistence, even if they were primed under inflammatory conditions. CFSE-labeled lymph node cells from CD90.1+ AND TCR transgenic mice were transferred into mice that were treated with 100 μg/ml dox for 24 h according to the indicated schedules and injected i.p. with PBS (left) or 10 nmol of the CpG-containing oligonucleotide 1668 (right). Subcutaneous lymph nodes were removed 48, 72, and 120 h after transfer and were analyzed by flow cytometry. All panels are gated on CD4+CD90.1+ cells.
Figure 7.
Figure 7.
Antigen persistence required for CD4+ effector cell differentiation. Lymph node cells from CD45.1+ AND TCR transgenic mice were CFSE labeled and transferred into Ii-rTA+TIM+ recipients exposed to 100 μg/ml dox in the drinking water for 24 h as indicated and analyzed 60 h later by flow cytometry. The histograms were gated on CD4+CD45.1+ cells, all other panels on CD4+ cells. The experiment was repeated with similar results.

Similar articles

Cited by

References

    1. Guermonprez, P., J. Valladeau, L. Zitvogel, C. Thery, and S. Amigorena. 2002. Antigen presentation and T cell stimulation by dendritic cells. Annu. Rev. Immunol. 20:621–667. - PubMed
    1. Itano, A.A., and M.K. Jenkins. 2003. Antigen presentation to naive CD4 T cells in the lymph node. Nat. Immunol. 4:733–739. - PubMed
    1. Catron, D.M., A.A. Itano, K.A. Pape, D.L. Mueller, and M.K. Jenkins. 2004. Visualizing the first 50 hr of the primary immune response to a soluble antigen. Immunity. 21:341–347. - PubMed
    1. Huang, A.Y., H. Qi, and R.N. Germain. 2004. Illuminating the landscape of in vivo immunity: insights from dynamic in situ imaging of secondary lymphoid tissues. Immunity. 21:331–339. - PubMed
    1. Trombetta, S.E., and I. Mellman. 2005. Cell biology of antigen processing in vitro and in vivo. Annu. Rev. Immunol. 23:975–1028. - PubMed

Publication types

MeSH terms

Substances