Comparative Study
. 2005 May 24;102(21):7589-94.
doi: 10.1073/pnas.0502935102. Epub 2005 May 16.

VEGF-integrin interplay controls tumor growth and vascularization

Affiliations
Comparative Study

VEGF-integrin interplay controls tumor growth and vascularization

Sarmishtha De et al. Proc Natl Acad Sci U S A. .

Abstract

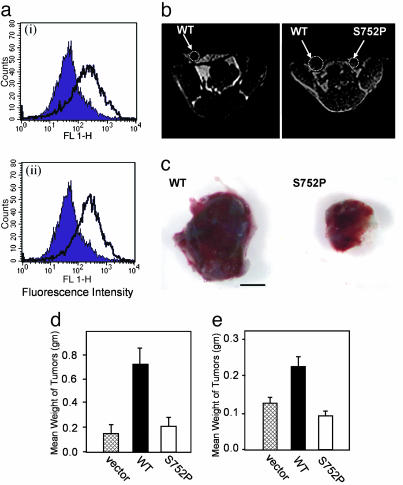
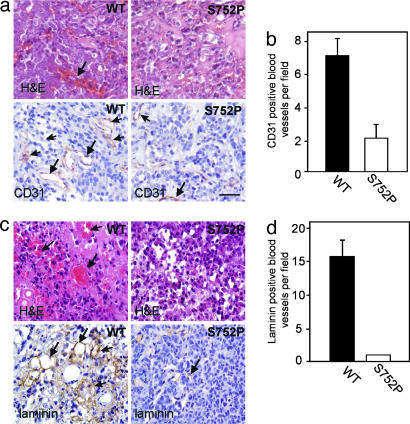
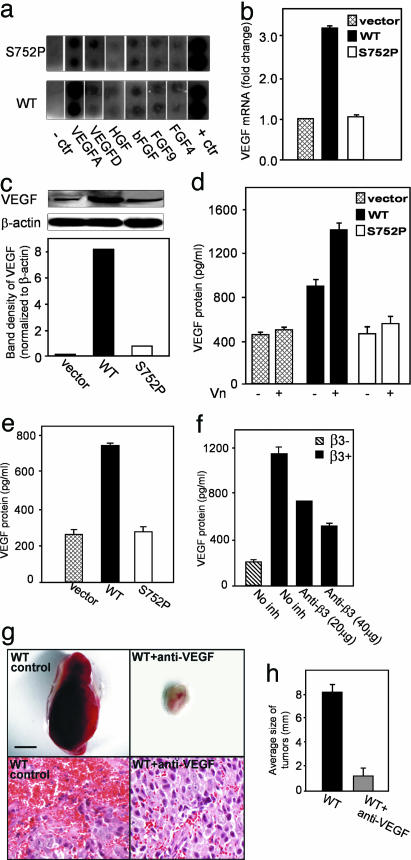
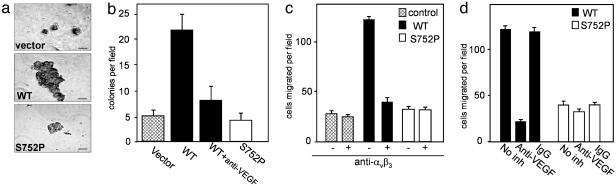
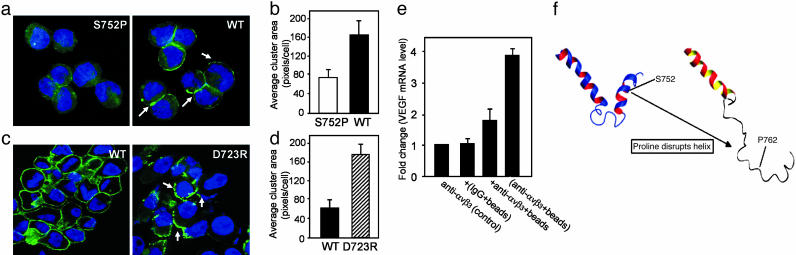
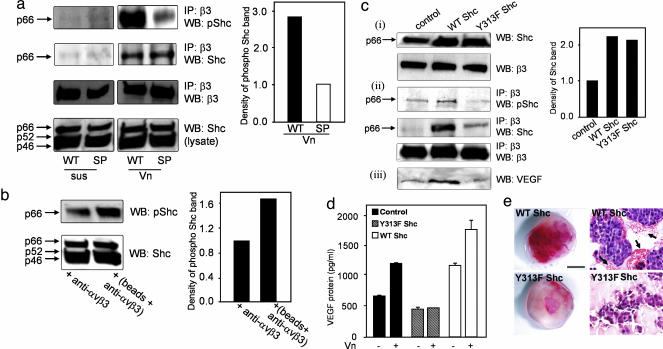
Cross-talk between the major angiogenic growth factor, VEGF, and integrin cell adhesion receptors has emerged recently as a critical factor in the regulation of angiogenesis and tumor development. However, the molecular mechanisms and consequences of this intercommunication remain unclear. Here, we define a mechanism whereby integrin alpha v beta3, through activation, clustering, and signaling by means of p66 Shc (Src homology 2 domain containing), regulates the production of VEGF in tumor cells expressing this integrin. Tumors with "activatable" but not "inactive" beta3 integrin secrete high levels of VEGF, which in turn promotes extensive neovascularization and augments tumor growth in vivo. This stimulation of VEGF expression depends upon the ability of alpha v beta3 integrin to cluster and promote phosphorylation of p66 Shc. These observations identify a link between beta3 integrins and VEGF in tumor growth and angiogenesis and, therefore, may influence anti-integrin as well as anti-VEGF therapeutic strategies.


Figures

Fig. 1.
Fig. 1.
Expression of functionally competent integrin β3 confers an in vivo growth advantage. (a) Representative FACS profiles of β3 expression in LNCaP-C4-2 cells transduced with αvβ3 WT (ai) and S752P (aii) (open) as compared with vector-transduced cells (filled). (b) MRI of s.c. tumors formed by LNCaP-C4-2 αvβ3WTand αvβ3 S752P cells. Shown are T1-weighted images of the same mouse at 3 (Left) and 4 (Right) weeks postinoculation. (c) LNCaP-C4-2αvβ3WT(Left) and LNCaP-C4-2 αvβ3 S752P (Right) tumors are shown 4 weeks postinjection. (Scale bar, 5 mm.) (d and e) Comparison of weight of LNCaP-C4-2-derived (d) and MDA-MB 231-derived (e) tumors, respectively. Data are expressed as mean tumor weight in grams ± SD; n = 8.
Fig. 2.
Fig. 2.
LNCaP-C4-2 and MDA-MB 231 tumor vascularization is determined by the activation state of tumor αvβ3. (a Upper) H&E staining for LNCaP-C4-2 αvβ3 WT and αvβ3 S752P tumor variants (4 weeks). Note extensive red blood cell leakage (arrows). (Lower) Blood vessels stained for CD31, an endothelial cell marker (arrows). (Scale bar, 50 μm.) (b) Vascular density based on CD31 staining is shown for tumors of LNCaP-C4-2 αvβ3WTand αvβ3 S752P origin (mean vessel number per field ± SD, 12 fields per tumor, four tumors per group). (c) H&E (Upper) and laminin (Lower) staining of MDA-MB 231 αvβ3 WT and S752P tumors. Vascular leakage and positive blood vessels are indicated by arrows. (d) The number of laminin-positive vessels per field was determined microscopically (mean vessel number per field ± SD, 12 fields per tumor, four tumors per group).
Fig. 3.
Fig. 3.
VEGF expression is regulated by the activation state of tumor αvβ3. (a) Growth factor secretion by LNCaP-C4-2 αvβ3 WT and S752P cells was assessed by using conditioned media and arrays from RayBiotech (see Materials and Methods). Note the difference in VEGF-A expression betweenαvβ3 WT and S752P cells. The first and last lanes represent the negative and positive controls, respectively. The experiment was repeated twice with similar results. (b and c) VEGF expression in 4-week-old LNCaP-C4-2 tumors (vector control, αvβ3 WT, and inactive αvβ3 S752P). (b) Results of real-time PCR with VEGF-specific primers. Data shown represent means ± SD of triplicate measurements of two tumors from each group. (c) Amount of VEGF protein in tumor lysates was analyzed by Western blotting by using β-actin as a loading control. (d) VEGF secretion by LNCaP-C4-2 cells αvβ3 WT, αvβ3 S752P, or control cells grown in wells coated with or without Vn was measured by ELISA. Data shown represent means ± SD of triplicate measurements of three experiments. (e) VEGF content in MDA-MB 231 control, αvβ3 WT, or αvβ3 S752P cell conditioned media was assessed as in d. (f) VEGF content in conditioned media of parental LNCaP-C4-2 cells (β3+) vs. a subline that has lost β3 integrin expression (β3–) was measured by ELISA. Effects of anti-β3 antibody treatment are also shown. Data shown represent means ± SD of triplicates of three experiments. (g and h) Comparison of tumors derived from LNCaP-C4-2 αvβ3 WT cell-injected mice treated with anti-VEGF antibody or with control IgG (2 weeks postinjection) (Upper). (Scale bar, 5 mm.) (Lower) H&E staining of fixed and sectioned tumors. (Scale bar, 50μm.) (h) Shown are means ± SD of tumor diameters (mm) (n = 5).
Fig. 4.
Fig. 4.
The activation state of αvβ3 influences tumor growth characteristics. (a and b) Comparison of anchorage-independent growth of LNCaP-C4-2 control (vector only), αvβ3 WT, and αvβ3 S752P cells in soft agar. (a) Note larger colonies formed by WT cells. (Scale bar, 50 μm.) (b) Shown are mean number of colonies per field ± SD of 10–12 random fields in 3 experiments. (c and d) Migration toward Vn depends on integrin αvβ3 functional state and VEGF. Migration of LNCaP-C4-2 αvβ3WT and S752P cells was assessed in the presence or absence of the anti-αvβ3 blocking antibody, LM609, as indicated (c), or in the presence of VEGF-neutralizing antibody or nonimmune IgG control (d). Migrated cells were counted in 10–12 random fields at ×200 magnification. Data shown represent means ± SD of three experiments.
Fig. 5.
Fig. 5.
Integrin αvβ3 clustering triggers VEGF expression. αvβ3 integrin clustering (arrows) was induced in live adherent cells by the anti-β3 activating antibody CRC54 (a and b) and by WOW-1 Fab (c and d) followed by Alexa Fluor 488 secondary. (a and b) Comparison of αvβ3 distribution in LNCaP-C4-2 αvβ3 WT and S752P cells (representative images are shown in a). (c and d) Comparison of αvβ3 clustering in LNCaP-C4-2 αvβ3 WT and D723R cells. (b and d) Integrin clustering was quantified by using image-pro plus 5.0. Data shown represent means ± SD of 10 fields in three separate experiments. (e) Binding of clustered, but not soluble, anti-αvβ3 antibody (LM609) induces VEGF expression. LNCaP-C4-2 αvβ3 WT were incubated with soluble antibody against αvβ3 (LM609) [anti-αvβ3 (control)] or with protein A/G Sepharose beads coated with control antibody, [(IgG+beads)], or with LM609 [(anti-αvβ3+beads)]. Alternatively, protein A/G Sepharose beads were added immediately after LM609 [+anti-αvβ3+beads]. Total RNA was isolated after 6 h, and VEGF mRNA expression was determined by real-time PCR by using VEGF specific primers and was quantified relative to control (assigned a value of 1). Data shown represent means ± SD of three experiments where each measurement was performed in triplicate. (f) Molecular modeling of the β3 cytoplasmic tail shows disruption of a C-terminal helix by the S752P mutation.
Fig. 6.
Fig. 6.
Phosphorylation of p66 Shc upon ligand binding and integrin clustering mediates VEGF expression. (a) LNCaP-C4-2 αvβ3 WT or S752P cells were kept in suspension (sus) or allowed to adhere to Vn (Vn) for 15 min. After immunoprecipitation of β3, immunoblotting was performed with an anti-phospho-Shc antibody (Y317), anti-Shc, or anti-β3 antibodies. Total cell lysates (Bottom) were immunoblotted with anti-Shc. Levels of phospho-Shc (pShc) were determined by densitometry. Results shown are representative of three separate experiments. (b)αvβ3 clustering was stimulated as described in Fig. 5. Comparison of phospho-Shc levels in cell lysates was performed by Western blot and densitometry. The experiment was repeated twice with identical results. (c and d) Dominant-negative p66 Shc inhibits VEGF expression. (c) LNCaP-C4-2αvβ3 WT cells were kept untransfected (control) or transiently transfected with WT p66 Shc or dominant-negative p66 Shc (Y313F). (ci) Shown is the amount of p66 Shc in cell lysates. (cii) Shown are levels of phospho-p66 Shc and total p66 Shc associated with β3. (ciii) Shown are VEGF levels in cell lysates. The data are representative of results from three independent experiments. (d) Overexpression of WT p66 Shc but not dominant-negative p66 Shc (Y313F) in LNCaP-C4-2 αvβ3 WT cells increased VEGF expression. After transient transfection, cells were plated in wells coated with or without Vn for 24 h, and VEGF in media was measured by ELISA after 24 h. Data shown represent means ± SD of three experiments where each measurement was performed in triplicate. (e) Dominant-negative Shc (Y313F Shc), but not WT Shc, inhibits tumor vascularization in vivo. Tumors formed by LNCaP-C4-2 αvβ3 WT cells coexpressing WT or Y313F p66Shc were excised 7 days postimplantation. (Scale bar, 5 mm.) (Right) H&E staining of tumor tissue sections. Vascular leakage is indicated by arrows.

References

    1. Neufeld, G., Cohen, T., Gengrinovitch, S. & Poltorak, Z. (1999) FASEB J. 13, 9–22. - PubMed
    1. Folkman, J. (2002) Semin. Oncol. 29, 15–18. - PubMed
    1. Ferrara, N. (2004) Endocr. Rev. 25, 581–611. - PubMed
    1. Varner, J. A. & Cheresh, D. A. (1996) in Important Advances in Oncology: 1996, eds. Devita, V. T., Hellman, S. & Rosenberg, S. A. (Lippincott Williams & Wilkins, Baltimore), pp. 69–87.
    1. Hong, Y. K., Lange-Asschenfeldt, B., Velasco, P., Hirakawa, S., Kunstfeld, R., Brown, L. F., Bohlen, P., Senger, D. R. & Detmar, M. (2004) FASEB J. 18, 1111–1113. - PubMed

Publication types

MeSH terms

Substances

LinkOut - more resources