

Review
doi: 10.1602/neurorx.2.2.167.
Foundations of advanced magnetic resonance imaging
Affiliations
- PMID: 15897944
- PMCID: PMC1064985
- DOI: 10.1602/neurorx.2.2.167
Item in Clipboard
Review
Foundations of advanced magnetic resonance imaging
NeuroRx.
2005 Apr.
Abstract
During the past decade, major breakthroughs in magnetic resonance imaging (MRI) quality were made by means of quantum leaps in scanner hardware and pulse sequences. Some advanced MRI techniques have truly revolutionized the detection of disease states and MRI can now-within a few minutes-acquire important quantitative information noninvasively from an individual in any plane or volume at comparatively high resolution. This article provides an overview of the most common advanced MRI methods including diffusion MRI, perfusion MRI, functional MRI, and the strengths and weaknesses of MRI at high magnetic field strengths.
Figures

Acute ischemic stroke of an 18-year-old man. Top row: Approximately 1.5–2 h after onset of clinical symptoms, conventional CT shows no clear signs of infarction. Middle row: Series of diffusion-weighted images obtained immediately after CT allows exact delineation of injured tissue. Bottom row: Follow-up CT clearly confirms findings on DWI examination. DWI was performed with a navigated diffusion-weighted interleaved EPI sequence.

Visualization of the proton displacement front due to diffusion. a: Isotropic diffusion occurs if diffusion is equal along all directions. b: For the same diffusion observation time interval, the proton displacement front (dotted line) is smaller in the presence of reduced diffusion. With anisotropic diffusion (c and d), diffusion differs along different directions.

a: Diffusion-weighted spin echo sequence: diffusion-weighting gradients are applied during each TE/2 period. The diffusion-weighted echo is sampled at the time t = TE when the spin echo is formed. The diffusion attenuation is only dependent on the parameters GDiff, Δ, and Δ but does not depend on t1. (GM = readout direction, GP = phase-encode direction, and GS = section select direction). b: Single-shot diffusion-weighted spin echo EPI pulse sequence. The entire k-space is filled with a single EPI-readout train. Because the EPI-train occupies much of the time available in the second TE/2 interval (tEPI/2), the maximum duration of the diffusion gradient lobes is mostly determined by the time TE/2-tEPI/2. c: Twice-refocused dual spin echo diffusion-weighted pulse sequence. The RF pulses (excite and refocus), diffusion gradients G of lengths Δ1, Δ2, Δ3, and Δ4, and an EPI readout are shown. Because the gradient pulses are shorter and have opposite polarity, the build-up of potent eddy currents is strongly reduced. Conversely, for the diffusing spins the bipolar gradient pair together with the refocusing RF pulse act as one long diffusion encoding gradient with efficient encoding power.

Diffusion-weighted images with diffusion-encoding along the (a) left-right, (b) anterior-posterior, and (c) caudo-cranial direction. Notice that white matter fibers running perpendicular to the gradient direction appear hyperintense because of lower values of diffusivity, whereas fibers running parallel to the gradient direction demonstrate lower signal intensities.

Processing of diffusion tensor information. a: From at least six DWIs with diffusion-encoding along noncollinear direction plus one reference image, one can compute the six independent elements of the diffusion tensor (left). Notice that Dij = Dji. By means of matrix diagonalization the eigenvalues (top right) and eigenvectors (top bottom) of the tensor can be computed. b: From the eigenvalues scalar, rotational invariant measures, i.e., trace of the diffusion tensor <D> (top) and relative anisotropy (RA, bottom) can be computed.

a: Without any correction, motion in the presence of strong diffusion-weighting gradients results in severe image degradation. b–e (left column, image space; right column, k-space): A simplified representation of image space and k-space for a simple object. The readout is shown in a heavy black line. b: No rigid body motion is present; c: effect of translation between acquisitions; d: effect of translation during diffusion gradients; e: in-plane rotation during the application of the diffusion gradients.
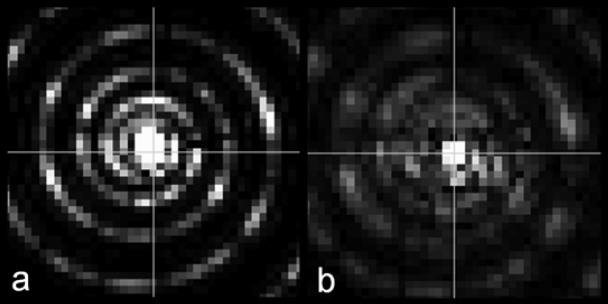
Comparison of the k-space data before and after image-based phase correction for one particular interleaf. Two white lines indicate the coordinate system. a: k-space data before correction. The data are displaced due to motion during the diffusion sensitizing gradients. b: k-space data after correction. The peak has been shifted back to the origin. Also notice that the intensity has been modified slightly because some nonlinear phase was corrected in the image space.

a: EPI is generally prone to distortions from susceptibility differences (arrows). b: Because of the small bandwidth per pixel eddy current induced gradients can cause significant distortions along the phase encoding direction. Depending on the diffusion-encoding gradient orientation this can lead to either sheared, scaled, or translated images.

Comparison between conventional diffusion-weighted single-shot EPI (a) and SENSE-EPI readout (b) in a stroke patient. By means of the faster k-space traversal with SENSE, the magnetic susceptibility artifacts or artifacts from B0-inhomogneities can be markedly diminished.

a: A radial or projection reconstruction acquisition, lines of k-space are acquired at varying angles, each of which passes through the center of k-space. b: Without echo centering the distortions of each projection are quite significant and lead to mediocre image quality. c: High-resolution DWI scan (same as in panel b) after echo centering and magnitude-only reconstruction.

a: A PROPELLER trajectory blade uses a Cartesian set of lines, with a greatly reduced kmax in one direction. This set of lines is then rotated about the origin of k-space, and acquired again. This leads to a set of intermediate images which are at the desired spatial resolution along the readout direction but have significantly lower resolution along the shorter dimension of the blade. These intermediate images allow one to perform phase navigation and leads to markedly improved image quality. b: DWI at 3T: Top row: EPI DWI demonstrates significant artifacts near air tissue interfaces. Typical signal pile up and loss as well as strong geometric distortions are apparent. Middle row: PROPELLER DWI with identical acquisition matrix demonstrates very few artifacts and provides significantly better image quality. In this implementation of PROPELLER, five gradient echoes were acquired between each refocusing RF pulse to speed up the acquisition. The overall acquisition time was comparable to the EPI scan. Bottom row: PROPELLER DWI at twice the acquisition matrix demonstrates high level of detail without significant distortions.
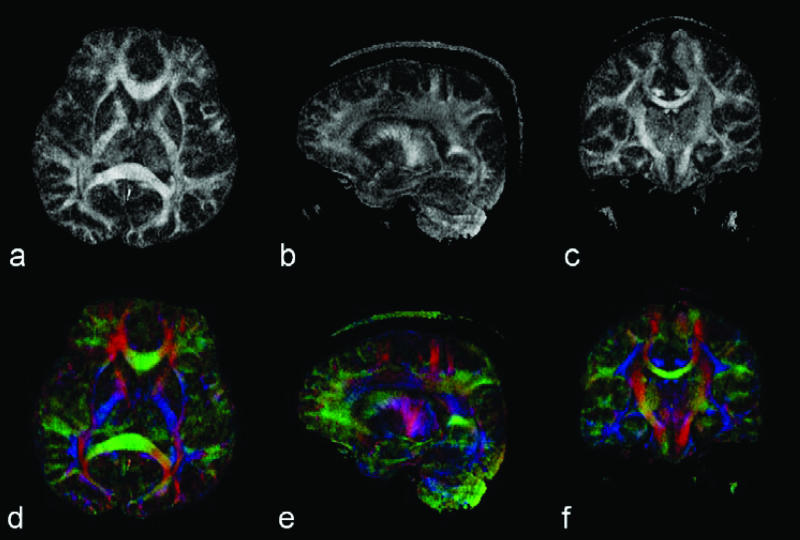
Top row: In vivo high-resolution (256 × 256) DTI results acquired with a VD spiral TRSE sequence. a–c: FA maps with axial, sagittal, and coronal orientation. Bottom row (d–f): Color-coded FA map. Red represents the direction of anterior-posterior; green represents left-right; and blue represents cephalo-caudal.

Fiber tracking results from a software built in house. 3D renderings of different fiber tracts are superimposed on axial and sagittal FA maps. Fiber orientation on FA maps is highlighted by color coding (left-right = red; anterior-posterior = green; cranio-caudal = blue).

Dynamic susceptibility contrast imaging. a: Time course of the T2*-weighted MR images during contrast material bolus passage. Due to the high concentration of contrast material the signal intensity decreases significantly during the peak of the bolus. b: The corresponding concentration time course demonstrates highest signal intensities during the peak of the bolus passage.

a: Contrast agent concentration time course in the feeding artery (Ca; AIF: solid line) and corresponding tissue response signal (Ct). b: Tissue residue function obtained by deconvolving Ct from Ca.

Capillary model of transit times. Due to varying capillary retention times, parts of the instantaneous bolus take longer to travel through the capillary network than others. For such an instantaneous bolus (i.e., infinite height, infinitesimal short) the venous output reflects the distribution of transit times and is equivalent to the impulse response function of the capillary system. The transit time distribution allows the computation of the mean transit time. The shape of a nonideal bolus affects the venous output.

Acute stroke patient. CBV, CBF, MTT and R(O) map of the residue function at t = 0 computed with the TSVD deconvolution approach. Clear perfusion deficits in the left middle cerebral artery territory are apparent.

A: Continuous arterial spin labeling of inflow in blood in the labeling slice leads to a slightly altered T1 relaxation in the measurement slice. Magnetization transfer can partially saturate spins in the measurement slice and may falsify perfusion measurements. A control experiment with labeling at the same distance distal to the measurement slice can counterbalance the MT effect. Venous return can be an additional confounder. Small local label coil are another alternative to restrict the MT effect and avoid venous return artifacts. Moreover, these coils allow selective assessment of vascular territories. B: EPISTAR and PICORE are typical representatives for pulsed ASL (PASL). With EPISTAR after saturation of the imaging slice, a slab proximal to the imaging slice is labeled using a single, short RF inversion pulse. The blood in this slab is then allowed to flow into the imaging slice, and an image is acquired after a time TI. A control image is also acquired for which the label is applied distal to the imaging slab (EPISTAR) or with no slab selective gradient (PICORE). C: Two inversion recovery images are acquired. The first follows a slice-selective inversion and thus has a signal intensity determined by an apparent, inflow-modulated T1 time; the second follows a global inversion and so (assuming blood and tissue relax at the same rate) has no flow enhancement (i.e., the image signal intensity is determined by intrinsic tissue T1).

T1 recovery is dependent on cerebral blood flow. Subtracting the labeled from the control acquisition results in a difference image which provides qualitative information about cerebral perfusion.

FAIR ASL experiment with variable inversion times. a: Resulting IR-FSE images obtained with different inversion times. b: Course of signal intensities depending on TI. Spins from the selectively inverted experiment experience a slightly faster T1 recovery due to the inflow of unsaturated blood. The IR curves allow the calculation of T1 maps from which, together with knowledge of the brain partition coefficient, a quantitative perfusion map can be computed.

Acute stroke patient with successful recanalization after IV tPA treatment. a: DWI within 6 h after stroke onset demonstrates a small lesion in the left middle cerebral artery territory. b: The area of perfusion deficit is apparent from the TMAX image (overlay on T2*-weighted baseline scan) and confirmed by complete occlusion of the MCA in the time of flight MRA (c). d–f: Follow-up scans 6 h later demonstrate successful reperfusion (d and f) and minimal lesion growth (d).
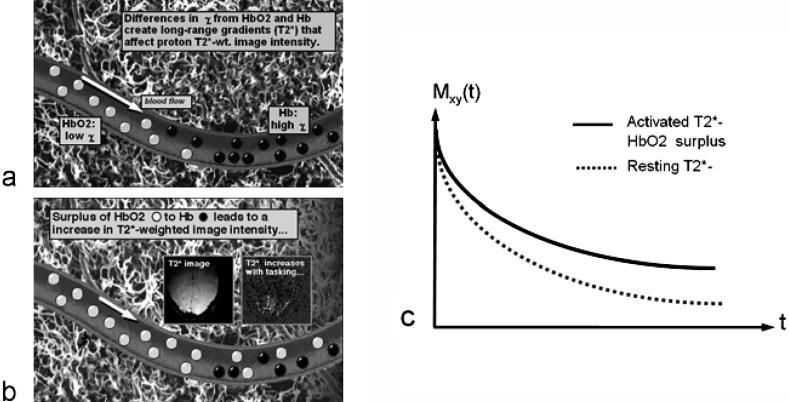
a: Hemoglobin as an MRI contrast agent. Regional blood oxygenation or deoxygenation in the brain can result from changes in local or global metabolic-related oxygen uptake, and changes in blood flow. This is manifested as an increase or decrease in signal intensity in T2*-weighted images. As the oxygenation state of hemoglobin changes to deoxyhemoglobin, the iron becomes paramagnetic and thus alters the local T2* by disturbing the local B0. This in essence causes decreases in T2*. b: As more oxygenated arterial blood is delivered to the voxel the T2* is then increased, causing an increase in signal. c: The T2* is higher in the activated state. The echo time with the optimal fMRI contrast is about equal to T2*.

fMRI processing. a: A usual fMRI experiment is conducted by alternating between two states (A and B), e.g., stimulation ON/OFF. b: The tissue response follows the stimulation pattern determined by the hemodynamic response function. c: A combination of the images from states A and B leads to an image (d) that demonstrates contrast in areas where functional activation occurred. For better localization the activation results are overlaid in color onto a morphologic reference image.

fMRI experiment with finger apposition (both hands). The increased sensitivity to functional activation at 3T (b) relative to 1.5T (a) is apparent.

fMRI experiment with finger apposition (both hands) (a and b) and visual stimulation (c and d). The increased sensitivity to functional activation at 3T (b and d) relative to 1.5T (a and c) is apparent.

MR-ToF maximum intensity projection (MIP) reconstruction demonstrating the strong benefit at 3T from increased T1 relaxation times. Even finest vessel structures appear that are not observed at 1.5T. The strong signal at 3T has been traded in high spatial resolution (0.2 × 0.2 × 0.6 mm3, 3T MAGNETOM Trio). Image courtesy of Dr. D. Parker, Advanced Research (Salt Lake City, UT).

Diffusion-weighted images (b =1000 s/mm2) without acceleration (left) and with a parallel imaging acceleration factor 2 (right). Frontal and temporal brain tissue exhibit significantly reduced distortions and signal loss with the use of parallel imaging (single shot EPI, matrix = 128 × 128, FOV = 220 mm, TE = 80 ms, 3T MAGNETOM Trio). Images courtesy of Prof. J. Frahm (MPI, Göttingen, Germany).

T1-weighted FLASH 2D image of the abdomen with fat saturation. (TR = 132 ms, TE = 2.8 ms, matrix = 154 × 256, FoV = 300 × 400 mm2, acquisition time = 20 s, 3T MAGNETOM Trio). Images courtesy of Silke Bosk (Siemens, Erlangen, Germany).
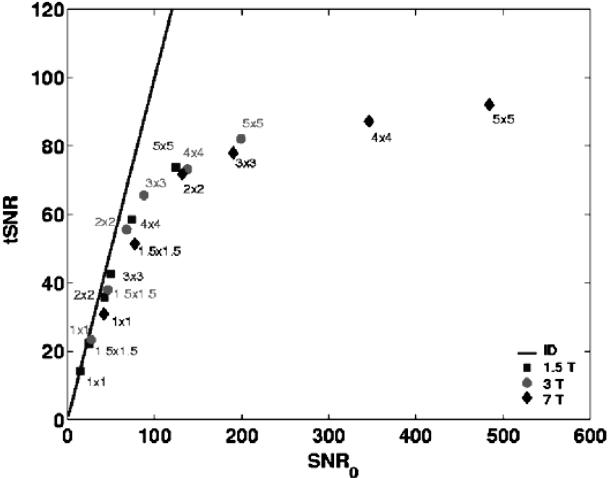
Signal to Noise Ratio (SNR) in fMRI time series (tSNR) as a function of image SNR (SNR0) for different spatial resolutions: this figure shows that the time series SNR at high-field strength is only exploited when going to smaller voxels. Changes in SNR were produced by varying the voxel volume. Labels indicate the in-plane resolution in mm2 at 3-mm slice thickness. Measurements were derived from areas of cortical gray matter and are averages over five subjects at each field strength. The solid line represents the line of identity (tSNR = SNR0). Data courtesy of C. Trianatfyllou (Martinos Center for Biomedical Imaging, Massachusetts General Hospital, Boston, MA).

3D T2-weighted images acquired with the variable flip echo technique that allows an approximate SAR reduction of 25% (3D turbo spin echo sequence, matrix = 222 × 256, FOV = 201 × 230 mm, TE = 366 ms, acquisition time = 6:45 min, 3T MAGNETOM Trio). Images courtesy of Wilhelm Horger (Siemens, Erlangen, Germany).
References
-
- Crank J. The mathematics of diffusion. New York: Oxford University Press, 1956.
-
- Basser PJ, Mattiello J, LeBihan D. Estimation of the effective self-diffusion tensor from the NMR spin echo. J Magn Reson 103: 247–254, 1994. - PubMed
-
- Basser PJ. Inferring microstructural features and the physiological state of tissues from diffusion-weighted images. NMR Biomed 8: 333–344, 1995. - PubMed
-
- Lansberg MG, Norbash AM, Marks MP, Tong DC, Moseley ME, Albers GW. Advantages of adding diffusion-weighted magnetic resonance imaging to conventional magnetic resonance imaging for evaluating acute stroke. Arch Neurol 57: 1311–1316, 2000. - PubMed
Publication types
MeSH terms
Grants and funding
LinkOut - more resources
Full Text Sources
Other Literature Sources
Medical
Miscellaneous
