Review
. 2005 Apr;2(2):277-303.
doi: 10.1602/neurorx.2.2.277.

Imaging of multiple sclerosis: role in neurotherapeutics

Affiliations
Review

Imaging of multiple sclerosis: role in neurotherapeutics

Rohit Bakshi et al. NeuroRx. 2005 Apr.

Abstract

Magnetic resonance imaging (MRI) plays an ever-expanding role in the evaluation of multiple sclerosis (MS). This includes its sensitivity for the diagnosis of the disease and its role in identifying patients at high risk for conversion to MS after a first presentation with selected clinically isolated syndromes. In addition, MRI is a key tool in providing primary therapeutic outcome measures for phase I/II trials and secondary outcome measures in phase III trials. The utility of MRI stems from its sensitivity to longitudinal changes including those in overt lesions and, with advanced MRI techniques, in areas affected by diffuse occult disease (the so-called normal-appearing brain tissue). However, all current MRI methodology suffers from limited specificity for the underlying histopathology. Conventional MRI techniques, including lesion detection and measurement of atrophy from T1- or T2-weighted images, have been the mainstay for monitoring disease activity in clinical trials, in which the use of gadolinium with T1-weighted images adds additional sensitivity and specificity for areas of acute inflammation. Advanced imaging methods including magnetization transfer, fluid attenuated inversion recovery, diffusion, magnetic resonance spectroscopy, functional MRI, and nuclear imaging techniques have added to our understanding of the pathogenesis of MS and may provide methods to monitor therapies more sensitively in the future. However, these advanced methods are limited by their cost, availability, complexity, and lack of validation. In this article, we review the role of conventional and advanced imaging techniques with an emphasis on neurotherapeutics.


Figures

FIG. 1.
FIG. 1.
Montage of five patients showing typical MRI features of MS. A: Post-contrast (left) and CSE T2-weighted (right) images are shown of a 51-year-old woman with RR MS. Note several enhancing foci in the periventricular region bilaterally. Lesions have a homogeneous appearance and show corresponding hyperintensity on the T2-weighted image. B: Baseline (left) and 5-year follow-up (right) CSE T2-weighted images of a 46-year-old woman with RR MS. EDSS score increased from 2.0 to 3.5 during this time. Note progressive number and total volume of T2-hyperintense lesions. C: FLAIR (left) and FSE T2-weighted (right) images of a 41-year-old woman with RR MS and EDSS score of 3 illustrates the superiority of FLAIR for the detection of periventricular lesions. Note the characteristic appearance of the lesions including an oval/ovoid morphology, size 5 mm or greater in diameter, and tendency to directly abut the ventricular margin. D: FLAIR (left) and FSE T2-weighted (right) images of a 51-year-old woman with RR MS and EDSS score of 4 shows the superiority of FLAIR for the detection of cortical/juxta-cortical lesions. Note the lesion in the left temporal lobe (arrow) seen by FLAIR but not on the T2-weighted image. E: Sagittal FLAIR of a 27-year-old woman with RR MS shows typical perivenular orientation of lesions. Note the lesions are perpendicular to the long axis of the lateral ventricles giving an appearance known as “Dawson's fingers.”
FIG. 2.
FIG. 2.
Evolution of T1 hypointensities (“black holes”). A 48-year-old woman with RR MS received serial MRI during the pretreatment screening period of a clinical trial. Noncontrast (upper row) and post-contrast (lower row) images are shown. Scans were obtained at baseline, 1 month, and 2 months later. Note the ring-enhancing lesion appearing at baseline that has corresponding T1 hypointensity (solid arrow). The ring enhancement has an incomplete or open ring that is typical of MS. The T1 hypointensity resolves 2 months later. A second T1 hypointensity develops over 2 months (broken arrow).
FIG. 3.
FIG. 3.
T1-weighted post contrast (left) and CSE T2-weighted (right) images of a 48-year-old woman with RR MS show a ring enhancing lesion and corresponding complex appearance on the T2 image.
FIG. 4.
FIG. 4.
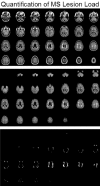
A quantitative computer-assisted semiautomated method of determining total brain T2 hyperintense lesion load illustrated in a patient with MS. Upper panel: raw FLAIR images; middle panel: after masking and nulling of skull, other extracranial tissue, and CSF flow artifacts; lower panel: after thresholding, the images are segmented into lesion versus nonlesion tissue; the area and volume of total brain lesions is determined based on the number of voxels retained.
FIG. 5.
FIG. 5.
MTR in normal appearing brain tissue (NABT) in MS. MRI scans are proton-density images (upper row) before (left) and after (right) masking of lesions and MTR maps coregistered to the source images and segmented to remove extracranial tissue and CSF, before (left) and after (right) masking of lesions. The upper right table is adapted with permssion from Tortorella et al. Magnetization transfer histogram study of normal-appearing brain tissue in MS. Neurology 54:186–193. Copyright © 2000. All rights reserved. It shows differences in MTR of NABT among MS and healthy controls groups. MS groups are: benign (BMS) RR MS, SP MS, and PP MS. n.s. = Nonsignificant. Lower right graph shows results of a published study on the lack of effect on interferon β 1-b (IFNB-1b) on progressive reduction of MTR of NABT in patients with SP MS. Figure is courtesy of Massimo Filippi, M.D.
FIG. 6.
FIG. 6.
Progressive brain atrophy in a 41-year-old man with RR MS imaged at baseline and 4 years later. Noncontrast T1-weighted images show progressive enlargement of the ventricles and subarachnoid spaces consistent with diffuse brain volume loss.
FIG. 7.
FIG. 7.
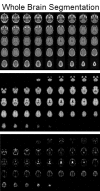
A quantitative computer-assisted semiautomated method of measuring brain parenchymal fraction, a normalized measure of whole brain volume. Source images and processing of images is shown. The upper panel is the raw 2D T1-weighted noncontrast axial series. The middle panel is the same images after masking (removal) of extracranial tissue. The lower panel shows segmented images after thresholding separates the parenchyma (black) and CSF (white) into two compartments.
FIG. 8.
FIG. 8.
Whole brain atrophy in MS as measured by brain parenchymal fraction (BPF) from Bakshi and colleagues. BPF is the ratio of the brain parenchyma to intracranial volume. Representative mid-ventricular axial noncontrast T1-weighted MRI scans are shown from age-matched individuals in the sixth decade. Note the progressive decrease in brain parenchyma, increase in CSF spaces, and decrease in BPF among the subjects from left to right in the figure. The first patient with RR MS has an EDSS score of 1.5 and disease duration (DD) of 5 years. The next patient with RR MS has an EDSS score of 4.0 and DD of 10 years. The patient with SP MS has an EDSS score of 6.5 and DD of 18 years.
FIG. 9.
FIG. 9.
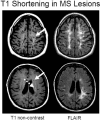
T1 shortening in MS lesions. Bright lesions on noncontrast T1-weighted MRI scans are shown in this montage of two patients. The anatomically matched FLAIR scans are shown on the right. Upper row: 44-year-old man with RR MS and EDSS score of 5.0. Lower row: 38-year-old woman with RR MS and EDSS score of 2.5. Note the T1-hyperintensity (arrows) of the periphery of some of the lesions.
FIG. 10.
FIG. 10.
T2 hypointensity and brain atrophy in MS. Hypointensity on T2-weighted images has been described in the gray matter of patients with MS and is related to physical disability, cognitive dysfunction, clinical course, MRI lesion load, and brain atrophy. The T2 hypointensity most likely represents pathologic iron deposition. CSE T2-weighted images are shown of a 44-year-old normal volunteer and an age-matched patient with RR MS (EDSS 5.0). In the latter, note the marked hypointensity of the deep gray matter nuclei, including the thalamus, caudate, and putamen. The patient also has brain volume loss compared to the control (note prominence of ventricular and subarachnoid spaces).
FIG. 11.
FIG. 11.
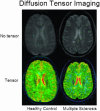
Diffusion tensor imaging in MS. A 25-year-old healthy woman and a 42-year-old woman with RR-MS with low disability (EDSS score =1) are shown. The top row depicts the b = 0 image, showing a white matter lesion in the patient's image. The bottom row shows glyphs representing the diffusion tensors, color coded by the degree of isotropy of the local diffusion tensor: red where the diffusion is most isotropic, and blue where the diffusion is most anisotropic. Note the increased isotropic diffusion in the region of the white matter lesion. Figure provided by Simon K. Warfield and Daniel Goldberg-Zimring.
FIG. 12.
FIG. 12.
PET imaging in MS. A patient with RR MS underwent MRI and fluorodeoxyglucose (FDG) PET of the brain. The T2-weighted MRI scan was coregistered with the FDG PET scan. A representative axial slice shows the source T2-weighted MRI scan (left) source FDG PET scan (right) and the resulting map obtained after 3D MRI-PET coregistration (middle). Glucose metabolism is displayed on a color scale (red is highest). Note the hypometabolism of the overt MRI lesions but also widespread hypometabolism of areas appearing normal on MRI in the cortical gray and subcortical white matter. Images are from Bakshi, Miletich, Kinkel, and colleagues.

Similar articles

Cited by

References

    1. McDonald WI, Compston A, Edan G, Goodkin D, Hartung HP, Lublin FD, et al. Recommended diagnostic criteria for multiple sclerosis: Guidelines from the International Panel on the Diagnosis of Multiple Sclerosis. Ann Neurol 121–127, 2001. - PubMed
    1. Miller DH, Filippi M, Fazekas F, Federiksen JL, Matthews PM, Montalban X, et al. Role of magnetic resonance imaging within diagnostic criteria for multiple sclerosis. Ann Neurol 56: 273–278, 2004. - PubMed
    1. Barkhof F, Rocca M, Francis G, Van Waesberghe JH, Uitdehaag BM, Hommes OR, et al. Validation of diagnostic magnetic resonance imaging criteria for multiple sclerosis and response to interferon β1a. Ann Neurol 53: 718–724, 2003. - PubMed
    1. Zivadinov R, Bakshi R. Role of MRI in multiple sclerosis I: inflammation and lesions. Front Biosci 9: 665–683, 2004. - PubMed
    1. Lai M, Hodgson T, Gawne-Cain M, Webb S, MacManus D, McDonald WI, et al. A preliminary study into the sensitivity of disease activity detection by serial weekly magnetic resonance imaging in multiple sclerosis. J Neurol Neurosurg Psychiatry 60: 339–341, 1996. - PMC - PubMed

Publication types