

Review
doi: 10.1602/neurorx.2.2.361.
Neuroimaging and therapeutics in movement disorders
Affiliations
- PMID: 15897956
- PMCID: PMC1064997
- DOI: 10.1602/neurorx.2.2.361
Item in Clipboard
Review
Neuroimaging and therapeutics in movement disorders
NeuroRx.
2005 Apr.
Abstract
In this review, we discuss the role of neuroimaging in assessing treatment options for movement disorders, particularly Parkinson's disease (PD). Imaging methods to assess dopaminergic function have recently been applied in trials of potential neuroprotective agents. Other imaging methods using regional metabolism and/or cerebral perfusion have been recently introduced to quantify the modulation of network activity as an objective marker of the treatment response. Both imaging strategies have provided novel insights into the mechanisms underlying a variety of pharmacological and stereotaxic surgical treatment strategies for PD and other movement disorders.
Figures
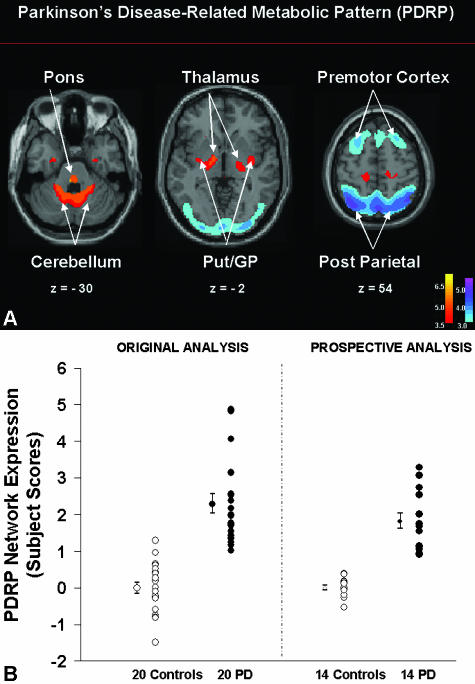
A: Parkinson's disease-related metabolic pattern. This pattern of regional metabolic covariation was identified by network analysis of [18F]-fluorodeoxyglucose (FDG) PET scans from 20 PD patients and 20 age-matched normal volunteer subjects., This PDRP (representing the first principal component, which accounted for 20.7% of the subject × voxel variation) was characterized by pallidal, thalamic, pontine, and cerebellar hypermetabolism associated with metabolic decrements in the lateral premotor and posterior parietal areas. The display represents voxels that contribute significantly to the network at p = 0.001, and that were demonstrated to be reliable by bootstrap estimation (p < 0.0001). [Voxels with positive region weights (metabolic increases) are color coded from red to yellow; those with negative region weights (metabolic decreases) are color coded from blue to purple. The numbers under each slice are in millimeters, relative to the anterior-posterior commissure line.] B: Prospectively computed PDRP scores accurately discriminate subjects by blinded network analysis. Left: PDRP expression (subject scores) in the 20 PD patients (filled circles) and 20 control subjects (open circles) described above. Network activity was significantly increased in the PD cohort (p < 0.00001). Right: In a prospective individual case analysis (see text), we computed the expression of the PDRP (see panel A) in 14 subsequent PD patients (filled circles) and 14 control subjects (open circles). These computations were conducted using an automated routine that was blind to diagnostic category., As in the original analysis, prospectively computed PDRP scores were significantly elevated in the disease group (p < 0.00001).
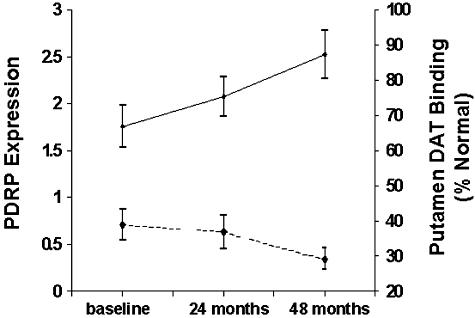
Longitudinal changes in early stage PD: dopaminergic loss and network evolution. Top: Mean expression of the PD-related metabolic covariance pattern (PDRP, see FIG. 1A) at baseline, and at the second (24 months) and third (36 months) time points as part of our longitudinal FDG PET study of early stage Parkinson's disease (solid line). PDRP values increased significantly over time (p < 0.005; repeated measures ANOVA). Bottom: Mean putamen DAT binding measured by [18F]-fluoropropyl βCIT PET in the same PD patients scanned longitudinally at the three time points (dashed line). DAT binding was expressed as percentage of the normal mean value for 15 age-matched control subjects. Unlike the longitudinal increases that occurred with PDRP expression, DAT binding declined over time (p < 0.04, reading a minimum of 30% normal for the putamen.
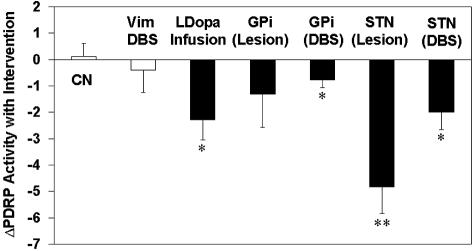
Network modulation with antiparkinsonian interventions. Bar graph illustrating relative changes in the expression of the PD-related metabolic covariance pattern (Δ PDRP; see text), during antiparkinsonian therapy with levodopa infusion, and unilateral ventral pallidotomy, pallidal and STN DBS,, and subthalamotomy (filled bars). For the surgical interventions, Δ PDRP reflects changes in network activity in the operated hemispheres. With levodopa infusion, the PDRP changes were averaged across hemispheres. [The control data (open bars) represent: 1) Δ PDRP values in the unoperated contralateral hemispheres (CN) of the surgical patients scanned in the unmedicated state; and 2) PDRP changes with unilateral Vim thalamic stimulation for tremor-predominant PD53]. [Asterisks represent p values with respect to the untreated condition (paired Student's t test). *: p < 0.01; **: p < 0.005].
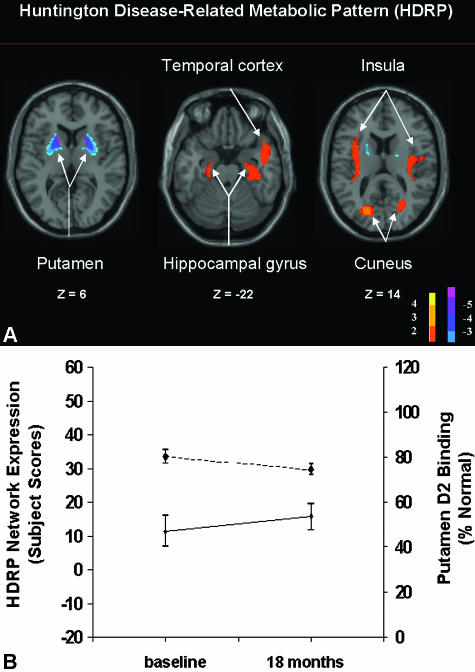
A: Huntington's disease-related metabolic pattern (HDRP). This pattern of regional metabolic covariation was identified by network analysis of [18F]-fluorodeoxyglucose (FDG) PET scans from 10 presymptomatic HD gene carriers and 20 age-matched normal volunteer subjects. This HDRP (representing the first principal component, which accounted for 18% of the subject × voxel variation) discriminated carriers from controls (p < 0.0001) and was characterized by relative metabolic decreases in the striatum, associated with increases in the temporal cortex, insula, and occipital association cortex. [The display represents voxels that contribute significantly to the network at p = 0.01. Voxels with positive region weights (metabolic increases) are color coded from red to yellow; those with negative region weights (metabolic decreases) are color coded from blue to purple. The numbers under each slice are in millimeters, relative to the anterior-posterior commissure line.] B: Preclinical progression of HDRP: dopaminergic loss and network evolution. Bottom: Mean expression of the HD-related metabolic covariance pattern (HDRP, see panel A) in preclinical gene carriers scanned at baseline and at 18 months as part of our longitudinal FDG PET study (solid line). HDRP values increased significantly over this time period (p < 0.03; paired t test). Top: Mean RAC binding in the same preclinical HD cohort scanned at baseline and at 18 months (dashed line). Striatal D2 receptor binding was abnormally reduced at both time points (p < 0.001 relative to gene negative controls). RAC binding declined significantly between the two time points (p < 0.05; paired t test).
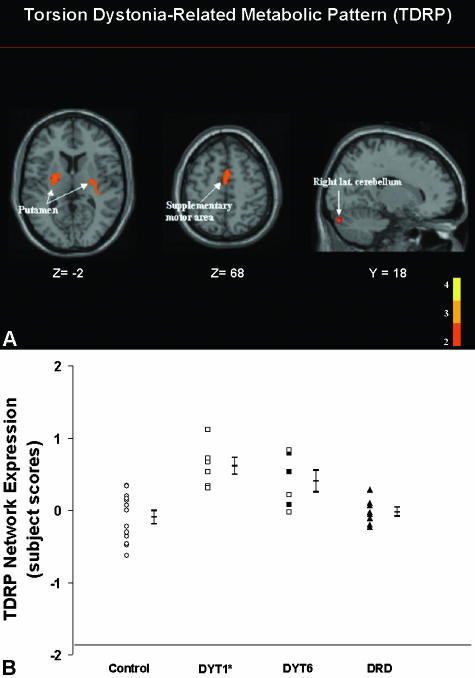
A: Torsion dystonia-related metabolic pattern (TDRP). This pattern of regional metabolic covariation was identified by network analysis of [18F]-fluorodeoxyglucose (FDG) PET scans from nonmanifesting DYT1 gene carriers and control subjects (see text). This TDRP was characterized by bilateral covarying metabolic increases in the putamen, extending into the globus pallidus (GP), the SMA, and the cerebellar hemisphere. Subject scores for this pattern discriminated the DYT1 carriers from controls (p < 0.002). The display represents voxels that contribute significantly to the network at p = 0.001. Voxels with positive region weights (metabolic increases) are color coded red. B: TDRP activity in dystonia genotypes (prospective FDG/PET study). Scatter diagram of torsion dystonia-related pattern subject scores computed prospectively in six new nonaffected DYT1 gene carriers, six DYT6 gene carriers, seven dopa-responsive dystonia (DRD) patients, and 13 control subjects. Subject scores were abnormally elevated in DYT1 (p < 0.001) and DYT6 carriers (p < 0.007), but not in DRD patients (p = 0.4). The error bars indicate subgroups standard errors of the mean. Circles, normal controls; squares, subjects with genotypes associated with primary torsion dystonia; triangles, DRD patients; open symbols, clinically nonmanifesting subjects; filled symbols, affected dystonia patients.
References
-
- Ravina B, Eidelberg D, Ahlskog JE, Albin R, Brooks DJ, Carbon M, et al. The role of radiotracer imaging in Parkinson's disease. Neurology 64: 208–215, 2005. - PubMed
-
- Eidelberg D, Moeller JR, Dhawan V, Spetsieris P, Takikawa S, Ishikawa T, et al. The metabolic topography of parkinsonism. J Cereb Blood Flow Metab 14: 783–801, 1994. - PubMed
-
- Feigin A, Antonini A, Fukuda M, De Notaris R, Benti R, Pezzoli G, et al. Tc-99m ethylene cysteinate dimer SPECT in the differential diagnosis of parkinsonism. Mov Disord 17: 1265–1270, 2002. - PubMed
-
- Eckert T, Eidelberg D. The role of functional neuroimaging in the differential diagnosis of idiopathic Parkinson's disease and multiple system atrophy. Clin Auton Res 14: 84–91, 2004. - PubMed
Publication types
MeSH terms
Substances
LinkOut - more resources
Full Text Sources
Other Literature Sources
Medical
