

Single and combined deletions of the NTAL/LAB and LAT adaptors minimally affect B-cell development and function
- PMID: 15899851
- PMCID: PMC1140644
- DOI: 10.1128/MCB.25.11.4455-4465.2005
Single and combined deletions of the NTAL/LAB and LAT adaptors minimally affect B-cell development and function
Abstract
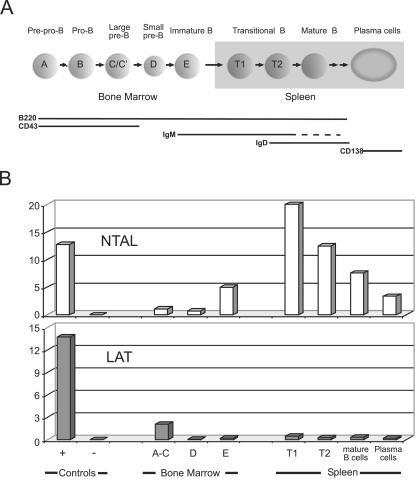
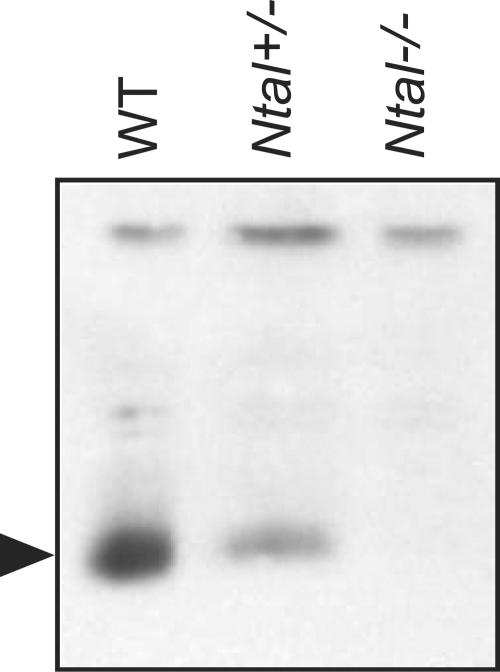
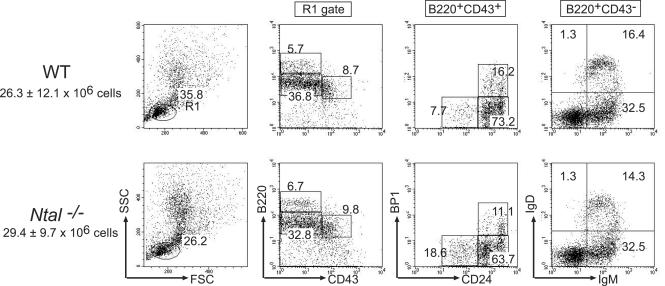
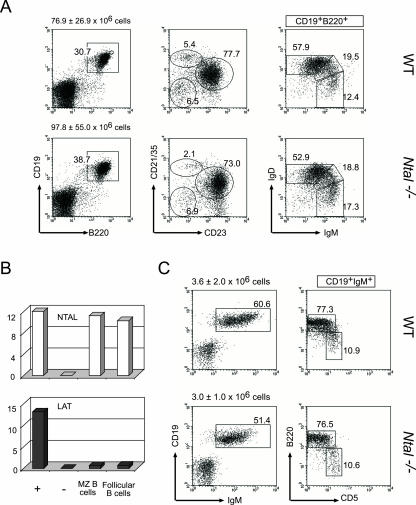
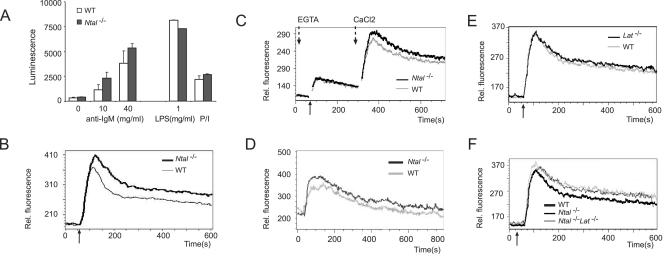
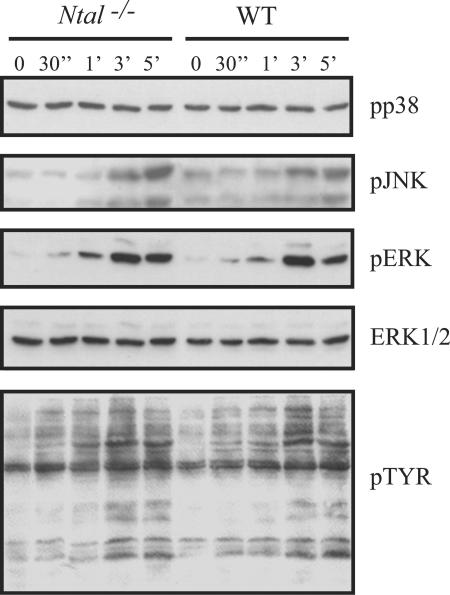
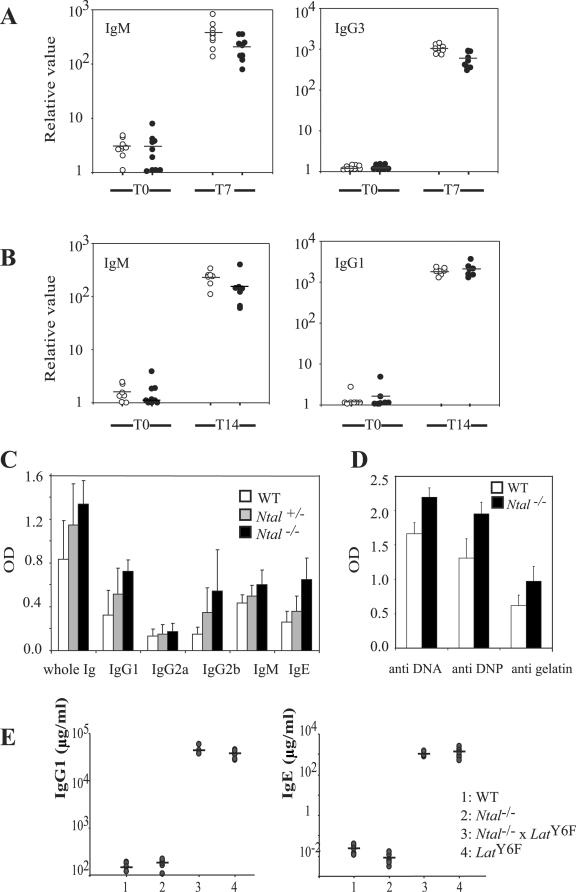
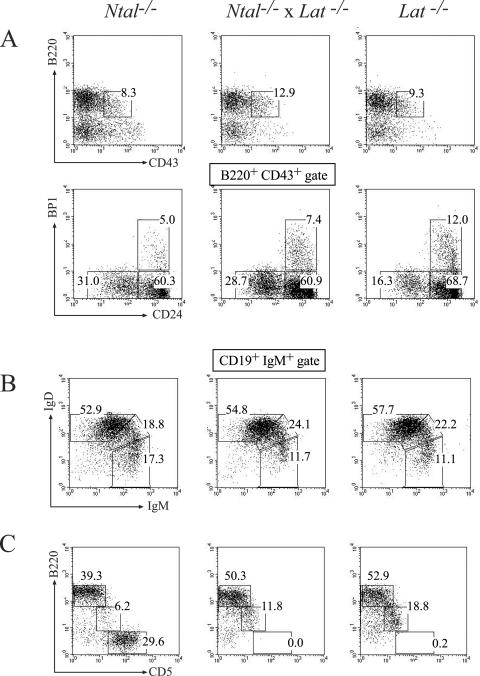
NTAL (non-T-cell activation linker, also called LAB) and LAT (linker for activation of T cells) are evolutionarily related transmembrane adaptor proteins that are phosphorylated upon immunoreceptor engagement. Using quantitative reverse transcription-PCR, both NTAL and LAT were found to be expressed in B cells. However, LAT expression was limited to early B cells, whereas NTAL expression typified mature B cells. To delineate their roles in B-cell development and function, Ntal-deficient mice were generated and crossed with Lat-deficient mice. B cells developed in Lat(-/-) Ntal(-/-) double-deficient mice and in mice lacking either of the two adaptors with the same efficiency as in wild-type mice. Upon B-cell antigen receptor cross-linking, Ntal(-/-) B cells exhibited slightly increased Ca(2+) mobilization and proliferation. In addition, Ntal-deficient mice had increased levels of natural antibodies and slightly increased humoral response to a T-dependent antigen. Normal titers of serum-specific immunoglobulins were produced in response to a T-cell-independent antigen. Although NTAL is also expressed in plasma cells, its absence did not affect the hypergammaglobulinemia E and G1 that developed in mice with a mutation in tyrosine 136 of LAT. Therefore, NTAL does not play a role in B cells symmetric to the role played by LAT in T cells.
Figures
Similar articles
-
LAT and NTAL mediate immunoglobulin E-induced sustained extracellular signal-regulated kinase activation critical for mast cell survival.Mol Cell Biol. 2007 Jun;27(12):4406-15. doi: 10.1128/MCB.02109-06. Epub 2007 Apr 9. Mol Cell Biol. 2007. PMID: 17420272 Free PMC article.
-
Deletion of the LIME adaptor protein minimally affects T and B cell development and function.Eur J Immunol. 2007 Nov;37(11):3259-69. doi: 10.1002/eji.200737563. Eur J Immunol. 2007. PMID: 17918199
-
NTAL/LAB and LAT: a balancing act in mast-cell activation and function.Trends Immunol. 2005 Mar;26(3):119-22. doi: 10.1016/j.it.2005.01.001. Trends Immunol. 2005. PMID: 15745852 Review. No abstract available.
-
Role of the LAT adaptor in T-cell development and Th2 differentiation.Adv Immunol. 2005;87:1-25. doi: 10.1016/S0065-2776(05)87001-4. Adv Immunol. 2005. PMID: 16102570 Review.
-
STAT6 deletion converts the Th2 inflammatory pathology afflicting Lat(Y136F) mice into a lymphoproliferative disorder involving Th1 and CD8 effector T cells.J Immunol. 2009 Mar 1;182(5):2680-9. doi: 10.4049/jimmunol.0803257. J Immunol. 2009. PMID: 19234162
Cited by
-
Thymic negative selection is functional in NOD mice.J Exp Med. 2012 Mar 12;209(3):623-37. doi: 10.1084/jem.20112593. Epub 2012 Feb 13. J Exp Med. 2012. PMID: 22329992 Free PMC article.
-
Identification of a new transmembrane adaptor protein that constitutively binds Grb2 in B cells.J Leukoc Biol. 2008 Sep;84(3):842-51. doi: 10.1189/jlb.0208087. Epub 2008 Jun 17. J Leukoc Biol. 2008. PMID: 18559951 Free PMC article.
-
Expression of Non-T Cell Activation Linker (NTAL) in Jurkat Cells Negatively Regulates TCR Signaling: Potential Role in Rheumatoid Arthritis.Int J Mol Sci. 2023 Feb 26;24(5):4574. doi: 10.3390/ijms24054574. Int J Mol Sci. 2023. PMID: 36902005 Free PMC article.
-
Subcellular localization of Grb2 by the adaptor protein Dok-3 restricts the intensity of Ca2+ signaling in B cells.EMBO J. 2007 Feb 21;26(4):1140-9. doi: 10.1038/sj.emboj.7601557. Epub 2007 Feb 8. EMBO J. 2007. PMID: 17290227 Free PMC article.
-
Vav and Rac activation in B cell antigen receptor endocytosis involves Vav recruitment to the adapter protein LAB.J Biol Chem. 2009 Dec 25;284(52):36202-36212. doi: 10.1074/jbc.M109.040089. Epub 2009 Oct 26. J Biol Chem. 2009. PMID: 19858206 Free PMC article.
References
-
- Aguado, E., S. Richelme, S. Nunez-Cruz, A. Miazek, A. M. Mura, M. Richelme, X. J. Guo, D. Sainty, H. T. He, B. Malissen, and M. Malissen. 2002. Induction of T helper type 2 immunity by a point mutation in the LAT adaptor. Science 296:2036-2040. - PubMed
-
- Brdicka, T., M. Imrich, P. Angelisova, N. Brdickova, O. Horvath, J. Spicka, I. Hilgert, P. Luskova, P. Draber, P. Novak, N. Engels, J. Wienands, L. Simeoni, J. Osterreicher, E. Aguado, M. Malissen, B. Schraven, and V. Horejsi. 2002. Non-T cell activation linker (NTAL): a transmembrane adaptor protein involved in immunoreceptor signaling. J. Exp. Med. 196:1617-1626. - PMC - PubMed
-
- Brdicka, T., M. Imrich, P. Angelisova, N. Brdickova, O. Horvath, J. Spicka, I. Hilgert, P. Luskova, P. Draber, P. Novak, N. Engels, J. Wienands, L. Simeoni, J. Osterreicher, E. Aguado, M. Malissen, B. Schraven, and V. V. Horejsi. 2002. Non-T Cell Activation Linker (NTAL): A transmembrane adaptor protein involved in immunoreceptor signaling. J. Exp. Med. 196:1617-1626. - PMC - PubMed
-
- Brdicka, T., D. Pavlistova, A. Leo, E. Bruyns, V. Korinek, P. Angelisova, J. Scherer, A. Shevchenko, I. Hilgert, J. Cerny, K. Drbal, Y. Kuramitsu, B. Kornacker, V. Horejsi, and B. Schraven. 2000. Phosphoprotein associated with glycosphingolipid-enriched microdomains (PAG), a novel ubiquitously expressed transmembrane adaptor protein, binds the protein tyrosine kinase csk and is involved in regulation of T cell activation. J. Exp. Med. 191:1591-1604. - PMC - PubMed
-
- Carsetti, R. 2004. Characterization of B-cell maturation in the peripheral immune system. Methods Mol. Biol. 271:25-35. - PubMed
Publication types
MeSH terms
Substances
LinkOut - more resources
Full Text Sources
Molecular Biology Databases
Research Materials
Miscellaneous