

Human-modified temperatures induce species changes: Joint attribution
- PMID: 15899975
- PMCID: PMC1129055
- DOI: 10.1073/pnas.0502286102
Human-modified temperatures induce species changes: Joint attribution
Abstract
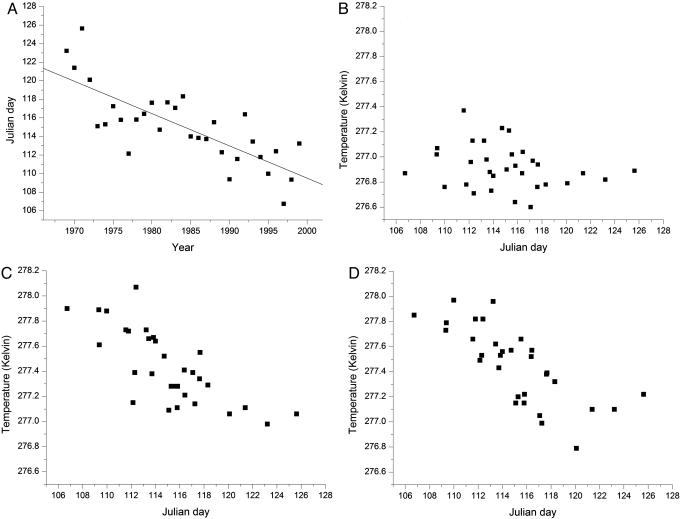
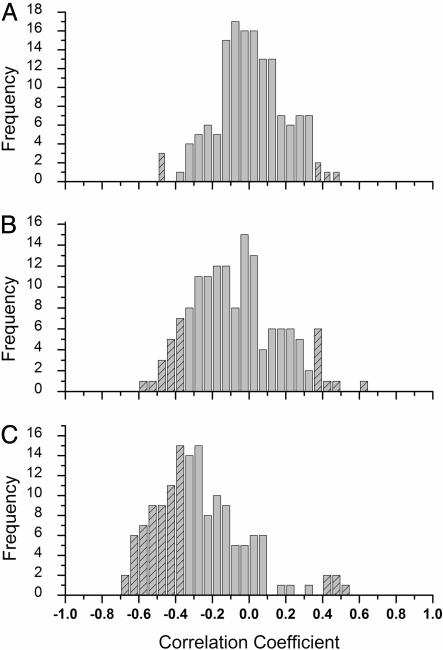
Average global surface-air temperature is increasing. Contention exists over relative contributions by natural and anthropogenic forcings. Ecological studies attribute plant and animal changes to observed warming. Until now, temperature-species connections have not been statistically attributed directly to anthropogenic climatic change. Using modeled climatic variables and observed species data, which are independent of thermometer records and paleoclimatic proxies, we demonstrate statistically significant "joint attribution," a two-step linkage: human activities contribute significantly to temperature changes and human-changed temperatures are associated with discernible changes in plant and animal traits. Additionally, our analyses provide independent testing of grid-box-scale temperature projections from a general circulation model (HadCM3).
Figures
References
-
- IPCC (2001) Climate Change 2001: The Science of Climate Change. Contribution of Working Group I to the Second Assessment Report of the Intergovernmental Panel on Climate Change (Cambridge Univ. Press, New York).
-
- Stott, P., Tett, S., Jones, G., Allen, M., Mitchell, J. & Jenkins, G. (2000) Science 290, 2133–2137. - PubMed
-
- Stott, P. (2003) Geophys. Res. Lett. 30, 1728.
-
- Santer, B., Wehner, M., Wigley, T., Sausen, R., Meehl, G., Taylor, K., Ammann, C., Arblaster, J., Washington, W. M., Boyle, J., et al. (2003) Science 301, 479–483. - PubMed
-
- Mann, M., Ammann, C., Bradley, R., Briffa, K., Crowley, T., Jones, P., Oppenheimer, M., Osborn, T., Overpeck, J., Rutherford, S., et al. (2003) Eos 84, 256–258.
Publication types
MeSH terms
LinkOut - more resources
Full Text Sources
