Comparative Study
. 2005 May 18;25(20):4908-16.
doi: 10.1523/JNEUROSCI.5155-04.2005.

Regulation of activin mRNA and Smad2 phosphorylation by antidepressant treatment in the rat brain: effects in behavioral models

Affiliations
Comparative Study

Regulation of activin mRNA and Smad2 phosphorylation by antidepressant treatment in the rat brain: effects in behavioral models

Antonia L Dow et al. J Neurosci. .

Abstract

Activin is a member of the transforming growth factor-beta family that is involved in cell differentiation, hormone secretion, and regulation of neuron survival. The cellular responses to activin are mediated by phosphorylation of a downstream target, Smad2. The current study examines the influence of chronic electroconvulsive seizures (ECSs), as well as chemical antidepressants, on the expression of activin betaA and the phosphorylation of Smad2 in the rat hippocampus and frontal cortex. Chronic ECSs (10 d) resulted in a significant increase in activin betaA mRNA expression and Smad2 phosphorylation in both the hippocampus and frontal cortex. Chronic fluoxetine did not influence activin betaA expression, but fluoxetine as well as desipramine did increase Smad2 phosphorylation in the frontal cortex. The functional significance of increased activin was further tested by examining the effects of activin infusions into the hippocampus on a behavioral model of depression, the forced swim test (FST). A single bilateral infusion of activin A or activin B into the dentate gyrus of the hippocampus produced an antidepressant-like effect in the FST that was comparable in magnitude with fluoxetine. In contrast, infusion of the activin antagonist inhibin A did not influence behavior but blocked the effect of activin A. The results suggest that regulation of activin and Smad signaling may contribute to the actions of antidepressant treatment and may represent novel targets for antidepressant drug development.


Figures
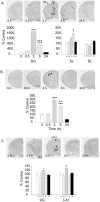
Figure 1.
Figure 1.
Acute ECS increases levels of activin βA mRNA in the hippocampus and cortex. Levels of activin βA and βB mRNA were determined by in situ hybridization analysis as described in Materials and Methods. A, Representative autoradiograms illustrate the time course for induction of activin βA mRNA in the dentate gyrus, superficial layer of the cortex, and deep layer of the cortex. The bar graphs show the optical density (OD) values for the mRNA levels (n = 4-5 per group). DG, F(4,18) = 263.38, p < 0.0001; SL, F(4,17) = 5.756, p < 0.01; DL, F(4,17) = 1.917, p > 0.05. B, Representative autoradiograms illustrate the time course of induction of activin βA mRNA in the frontal cortex. Arrowheads indicate superficial layers of the cerebral cortex. The bar graph shows the OD values for the mRNA levels (n = 4-5 per group). F(4,18) = 31.08; p < 0.0001. C, Representative autoradiograms illustrate that acute ECS does not increase levels of activin βB mRNA in the dentate gyrus of the hippocampus at any time point examined but does increase levels in the CA1 of the hippocampus at 2 h after seizure. The bar graph shows the OD values for the mRNA levels (n = 4-5 per group). DG, F(4,17) = 1.122, p > 0.05; CA1, F(4,17) = 4.752, p < 0.01. The results are the mean ± SEM. *p < 0.05, ***p < 0.001 compared with 0 h; ++p < 0.01, +++p < 0.001 compared with 2 h (ANOVA and Newman-Keuls test). DG, Dentate gyrus; SL, superficial layer of the cortex; DL, deep layer of the cortex.
Figure 2.
Figure 2.
Influence of chronic ECS or fluoxetine on levels of activin βA mRNA in the hippocampus and cerebral cortex. Levels of activin βA mRNA were determined by in situ hybridization analysis as described in Materials and Methods. A, Representative autoradiograms illustrate the induction of activin βA mRNA in the dentate gyrus after both acute and chronic ECS. The bar graph shows the optical density (OD) values for the mRNA levels (n = 5-6 per group). F(2,14) = 18.7646, p < 0.001. B, Representative autoradiograms illustrate the induction of activin βA mRNA in the frontal cortex after both acute and chronic ECS. Triple arrowheads indicate the superficial layers of the cerebral cortex. The bar graph shows the OD values for the mRNA levels (n = 5-6 per group). F(2,14) = 8.2985, p < 0.01. C, Representative autoradiograms illustrate that there is no difference in activin βA mRNA levels after fluoxetine (5 mg · kg · d) treatment in the hippocampus (left two panels) or the frontal cortex (right two panels). The graph shows the OD values for the mRNA levels (n = 6 per group). DG, F(1,10) = 0.4732, p > 0.05; frontal cortex, F(1,10) = 0.0522, p > 0.05. The results are the mean ± SEM. *p < 0.05, ***p < 0.001 compared with sham; +p < 0.05 compared with acute (ANOVA and Newman-Keuls test). DG, Dentate gyrus; FLX, fluoxetine.
Figure 3.
Figure 3.
Phosphorylation of Smad2 is increased in the hippocampus and frontal cortex after ECS. Levels of pSmad2, Smad2, and Smad4 were determined by Western blot analysis as described in Materials and Methods. A, Representative immunoblots illustrate the time course of induction of pSmad2 in the hippocampus. There is no changein total Smad2 levels. The bar graph shows the optical density (OD) values for pSmad2 and Smad2 (n = 4 per group). pSmad2, F(5,18) = 20.739, p < 0.0001; Smad2, F(5,18) = 1.2694, p > 0.05. B, Representative immunoblots illustrate the time course of induction of pSmad2 in the frontal cortex. There is no change in total Smad2 levels. The bar graph shows the OD values for pSmad2 and Smad2 (n = 3-4 per group). pSmad2, F(5,17) = 4.4753, p < 0.01; Smad2, F(5,17) = 1.4499, p > 0.05. C, Representative immunoblots illustrate the increased levels of pSmad2 in the hippocampus 6 h after acute and chronic ECS. The bar graph shows the OD values for pSmad2, Smad2, and Smad4 (n = 4 per group). pSmad2, F(2,9) = 80.606, p < 0.0001; Smad2, F(2,9) = 0.8532, p > 0.05; Smad4, F(2,9) = 0.2916, p > 0.05. D, Representative immunoblots illustrate the increased levels of pSmad2 in the frontal cortex 6 h after acute and chronic ECS. The bar graph shows the OD values for pSmad2, Smad2, and Smad4 (n = 5-6 per group). pSmad2, F(2,14) = 66.263, p < 0.0001; Smad2, F(2,14) = 0.2544, p > 0.05; Smad4, F(2,14) = 0.4226, p > 0.05. The results are the mean ± SEM. *p < 0.05, ***p < 0.001 compared with the sham treatment; +++ p < 0.001 compared with acute ECS (ANOVA and Newman-Keuls test). S, Sham; A, acute; C, chronic.
Figure 4.
Figure 4.
Fluoxetine and desipramine increase Smad2 phophorylation in the frontal cortex. Levels of pSmad2, Smad2, and Smad4 were determined by Western blot analysis as described in Materials and Methods. A, Representative immunoblots illustrate the increased level of pSmad2 in the frontal cortex as a result of fluoxetine (5 mg · kg · d) treatment with no difference in total Smad2 or Smad4 levels. The graphs show the optical density (OD) values for pSmad2, Smad2, and Smad4 in both the frontal cortex and the hippocampus (n = 6 per group). Frontal cortex: pSmad2, F(1,10) = 5.181, p < 0.05; Smad2, F(1,10) = 0.0052, p > 0.05; Smad4, F(1,10) = 0.213, p > 0.05; Hippocampus: pSmad2, F(1,10) = 1.87, p > 0.05; Smad2, F(1,10) = 1.9, p > 0.05; Smad4, F(1,10) = 2.18, p > 0.05. B, Representative immunoblots illustrate the increased level of pSmad2 in the frontal cortex as a result of desipramine (10 mg · kg · d) treatment with no difference in total Smad2 or Smad4 levels. The bar graphs show the OD values for pSmad2, Smad2, and Smad4 in both the frontal cortex and the hippocampus (n = 6 per group). Frontal cortex: pSmad2, F(1,10) = 5.3699, p < 0.05; Smad2, F(1,10) = 0.1563, p > 0.05; Smad4, F(1,10) = 0.4124, p > 0.05; hippocampus: pSmad2, F(1,10) = 0.0636, p > 0.05; Smad2, F(1,10) = 0.4919, p > 0.05; Smad4, F(1,10) = 2.183, p > 0.05. The results are the mean ± SEM. *p < 0.05 compared with the corresponding controls (Student's t test). C, Control; F, fluoxetine; D, desipramine.
Figure 5.
Figure 5.
Infusions of activin A into the dentate gyrus of the hippocampus have an antidepressant effect in the FST. Animals were exposed to inescapable swimming for 15 min and 30 min later were administered the antidepressants or growth factors as indicated. A, Fluoxetine and desipramine were administered by intraperitoneal injection three times over a 24 h period as described in Materials and Methods. Activin A (B, C), activin B (D), or 1% BSA were infused bilaterally into the dentate gyrus (B, D) or the CA1 (C) of the hippocampus at the doses indicated. Animals were tested 24 h after the initial swimming session, and immobility, swimming, and climbing were scored. A, Immobility, F(2,11) = 13.384, p < 0.01; swimming, F(2,11) = 8.7833, p < 0.01; climbing, F(2,11) = 13.356, p < 0.01. B, Immobility, F(2,18) = 24.834, p < 0.0001; swimming, F(2,18) = 17.437, p < 0.0001; climbing, F(2,18) = 1.2034, p > 0.05. C, Immobility, F(1,13) = 0.0313, p > 0.05; swimming, F(1,13) = 1.611, p > 0.05; climbing, F(1,13) = 1.232, p > 0.05. D, Immobility, F(1,7) = 6.479, p < 0.05; swimming, F(1,7) = 7.978, p < 0.05; climbing, F(2,18) = 0.0465, p > 0.05. The results are expressed as mean ± SEM. *p < 0.05, **p < 0.01, ***p < 0.001 compared with the corresponding BSA- or saline-injected controls; +++p < 0.001 compared with the 1.0 μg activin A-infused animals (ANOVA and Newman-Keuls test).
Figure 6.
Figure 6.
Infusions of inhibin A into the dentate gyrus of the hippocampus did not effect immobility when infused alone but reversed the effect of activin A. Activin A, inhibin A, activin A plus inhibin A, or vehicle was infused into the dentate gyrus 30 min after the first swimming session and 24 h later were tested as described in Materials and Methods. Because there was no difference between 0.1% BSA and 5% BSA (vehicle for activin A or inhibin A, respectively), the data were combined. The results are the mean ± SEM. ***p < 0.001 compared with the corresponding BSA-infused controls; ++p < 0.01, +++p < 0.001 compared with activin A-infused animals (ANOVA and Newman-Keuls test). Immobility, F(3,21) = 7.3664, p < 0.01; swimming, F(3,21) = 13.316, p < 0.0001; climbing, F(3,21) = 1.0550, p > 0.05.
Figure 7.
Figure 7.
Influence of activin A infusion into the dentate gyrus of the hippocampus on locomotor activity. Activin A or 0.1% BSA in PBS was infused into the dentate gyrus 30 min after the first swimming session, and 24 h later, the total number of beam breaks in 5 min bins was recorded for a total of 60 min. The results are the mean ± SEM. Treatment, F(1,8) = 0.573, p > 0.05; time, F(11,88) = 21.766, p < 0.0001; treatment × time, F(11,88) = 1.025, p > 0.05. There was a significant decrease in locomotor activity for both groups over time as the animals habituated to the test chambers, but there was no significant treatment by time interaction (repeated-measures ANOVA).
Figure 8.
Figure 8.
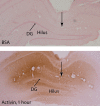
Activin A immunohistochemistry after local infusion into the hippocampus. Activin A (1.0 μg) was infused into the dentate gyrus (DG), and activin A immunolabeling was determined 1 h after infusion. Representative sections are shown. Large arrows indicate the site of infusion.

Similar articles

Cited by

References

    1. Andreasson K, Worley PF (1995) Induction of β-A activin expression by synaptic activity and during neocortical development. Neuroscience 69: 781-796. - PubMed
    1. Bengtsson H, Soderstrom S, Ebendal T (1995) Expression of activin receptors type I and II only partially overlaps in the nervous system. NeuroReport 7: 113-116. - PubMed
    1. Bottner M, Krieglstein K, Unsicker K (2000) The transforming growth factor-βs: structure, signaling, and roles in nervous system development and functions. J Neurochem 75: 2227-2240. - PubMed
    1. Cameron VA, Nishimura E, Mathews LS, Lewis KA, Sawchenko PE, Vale WW (1994) Hybridization histochemical localization of activin receptor subtypes in rat brain, pituitary, ovary, and testis. Endocrinology 134: 799-808. - PubMed
    1. Detke MJ, Rickels M, Lucki I (1995) Active behaviors in the rat forced swimming test differentially produced by serotonergic and noradrenergic antidepressants. Psychopharmacology 121: 66-72. - PubMed

Publication types

MeSH terms