

Multisensory integration of dynamic faces and voices in rhesus monkey auditory cortex
- PMID: 15901781
- PMCID: PMC6724848
- DOI: 10.1523/JNEUROSCI.0799-05.2005
Multisensory integration of dynamic faces and voices in rhesus monkey auditory cortex
Abstract
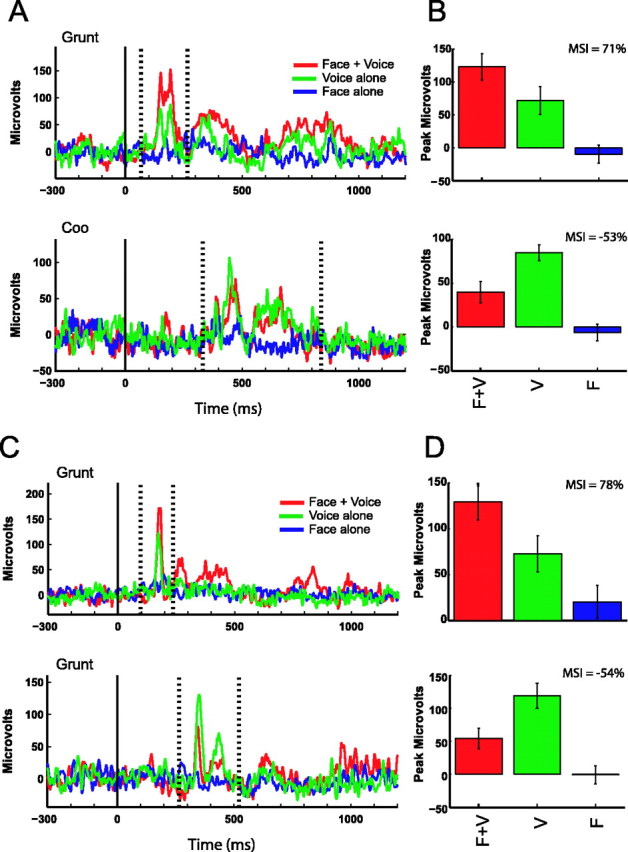
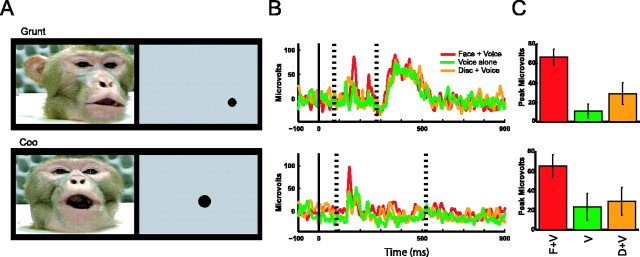
In the social world, multiple sensory channels are used concurrently to facilitate communication. Among human and nonhuman primates, faces and voices are the primary means of transmitting social signals (Adolphs, 2003; Ghazanfar and Santos, 2004). Primates recognize the correspondence between species-specific facial and vocal expressions (Massaro, 1998; Ghazanfar and Logothetis, 2003; Izumi and Kojima, 2004), and these visual and auditory channels can be integrated into unified percepts to enhance detection and discrimination. Where and how such communication signals are integrated at the neural level are poorly understood. In particular, it is unclear what role "unimodal" sensory areas, such as the auditory cortex, may play. We recorded local field potential activity, the signal that best correlates with human imaging and event-related potential signals, in both the core and lateral belt regions of the auditory cortex in awake behaving rhesus monkeys while they viewed vocalizing conspecifics. We demonstrate unequivocally that the primate auditory cortex integrates facial and vocal signals through enhancement and suppression of field potentials in both the core and lateral belt regions. The majority of these multisensory responses were specific to face/voice integration, and the lateral belt region shows a greater frequency of multisensory integration than the core region. These multisensory processes in the auditory cortex likely occur via reciprocal interactions with the superior temporal sulcus.
Figures


Similar articles
-
Interactions between the superior temporal sulcus and auditory cortex mediate dynamic face/voice integration in rhesus monkeys.J Neurosci. 2008 Apr 23;28(17):4457-69. doi: 10.1523/JNEUROSCI.0541-08.2008. J Neurosci. 2008. PMID: 18434524 Free PMC article.
-
Hemodynamic responses in human multisensory and auditory association cortex to purely visual stimulation.BMC Neurosci. 2007 Feb 6;8:14. doi: 10.1186/1471-2202-8-14. BMC Neurosci. 2007. PMID: 17284307 Free PMC article.
-
Visuo-auditory interactions in the primary visual cortex of the behaving monkey: electrophysiological evidence.BMC Neurosci. 2008 Aug 12;9:79. doi: 10.1186/1471-2202-9-79. BMC Neurosci. 2008. PMID: 18699988 Free PMC article.
-
The multisensory roles for auditory cortex in primate vocal communication.Hear Res. 2009 Dec;258(1-2):113-20. doi: 10.1016/j.heares.2009.04.003. Epub 2009 Apr 14. Hear Res. 2009. PMID: 19371776 Free PMC article. Review.
-
A unified coding strategy for processing faces and voices.Trends Cogn Sci. 2013 Jun;17(6):263-71. doi: 10.1016/j.tics.2013.04.004. Epub 2013 May 10. Trends Cogn Sci. 2013. PMID: 23664703 Free PMC article. Review.
Cited by
-
Visual cortical areas of the mouse: comparison of parcellation and network structure with primates.Front Neural Circuits. 2015 Jan 7;8:149. doi: 10.3389/fncir.2014.00149. eCollection 2014. Front Neural Circuits. 2015. PMID: 25620914 Free PMC article. Review.
-
Rapid brain discrimination of sounds of objects.J Neurosci. 2006 Jan 25;26(4):1293-302. doi: 10.1523/JNEUROSCI.4511-05.2006. J Neurosci. 2006. PMID: 16436617 Free PMC article.
-
A temporal hierarchy for conspecific vocalization discrimination in humans.J Neurosci. 2010 Aug 18;30(33):11210-21. doi: 10.1523/JNEUROSCI.2239-10.2010. J Neurosci. 2010. PMID: 20720129 Free PMC article.
-
Faces and Voices Processing in Human and Primate Brains: Rhythmic and Multimodal Mechanisms Underlying the Evolution and Development of Speech.Front Psychol. 2022 Mar 30;13:829083. doi: 10.3389/fpsyg.2022.829083. eCollection 2022. Front Psychol. 2022. PMID: 35432052 Free PMC article. Review.
-
The neurobiology of vocal communication in marmosets.Ann N Y Acad Sci. 2023 Oct;1528(1):13-28. doi: 10.1111/nyas.15057. Epub 2023 Aug 24. Ann N Y Acad Sci. 2023. PMID: 37615212 Free PMC article. Review.
References
-
- Abry C, Lallouache M-T, Cathiard M-A (1996) How can coarticulation models account for speech sensitivity in audio-visual desynchronization? In: Speechreading by humans and machines: models, systems and applications (Stork D, Henneke M, eds), pp 247-255. Berlin: Springer.
-
- Adolphs R (2003) The cognitive neuroscience of human social behaviour. Nat Rev Neurosci 4: 165-178. - PubMed
-
- Barraclough NE, Xiao D, Baker CI, Oram MW, Perrett DI (2005) Integration of visual and auditory information by superior temporal sulcus neurons responsive to the sight of actions. J Cogn Neurosci 17: 377-391. - PubMed
-
- Beauchamp MS, Lee KE, Argall BD, Martin A (2004) Integration of auditory and visual information about objects in superior temporal sulcus. Neuron 41: 809-823. - PubMed
Publication types
MeSH terms
LinkOut - more resources
Full Text Sources
Other Literature Sources