

Genome-wide expression analysis of therapy-resistant tumors reveals SPARC as a novel target for cancer therapy
- PMID: 15902309
- PMCID: PMC1090471
- DOI: 10.1172/JCI23002
Genome-wide expression analysis of therapy-resistant tumors reveals SPARC as a novel target for cancer therapy
Abstract
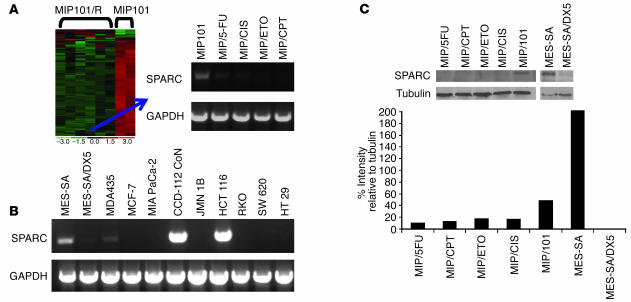
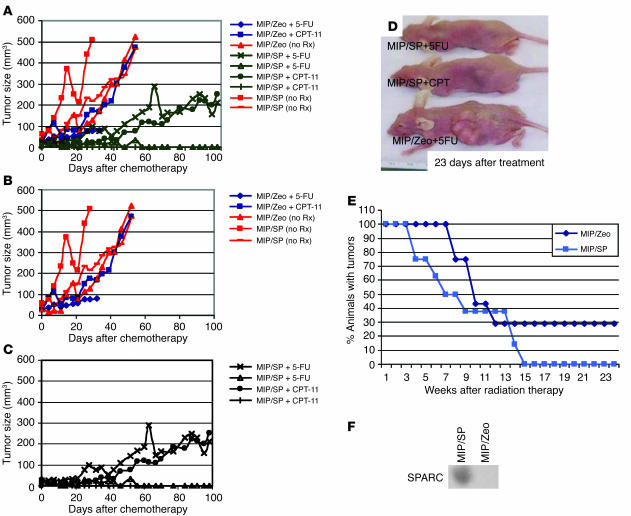
Overcoming resistance to chemotherapy and radiation therapy has been a difficult but important goal in the effort to cure cancer. We used gene-expression microarrays to identify differentially expressed genes involved in colorectal cancer resistance to chemotherapy and identified secreted protein, acidic and rich in cysteine (osteonectin) (SPARC) as a putative resistance-reversal gene by demonstrating low SPARC expression in refractory human MIP101 colon cancer cells. We were able to achieve restoration of their radiosensitivity and sensitivity to 5-fluorouracil and irinotecan by reexpression of SPARC in tumor xenografts. Moreover, treatment of mice with SPARC conferred increased sensitivity to chemotherapy and led to significant regression of xenografted tumors. The results show that modulation of SPARC expression affects colorectal cancer sensitivity to radiation and chemotherapy. SPARC-based gene or protein therapy may ameliorate the emergence of resistant clones and eradicate existing refractory clones and offers a novel approach to treating cancer.
Figures


Similar articles
-
Synergism between vitamin D and secreted protein acidic and rich in cysteine-induced apoptosis and growth inhibition results in increased susceptibility of therapy-resistant colorectal cancer cells to chemotherapy.Mol Cancer Ther. 2007 Jan;6(1):309-17. doi: 10.1158/1535-7163.MCT-06-0517. Mol Cancer Ther. 2007. PMID: 17237289
-
Pemetrexed disodium combined with oxaliplatin, SN38, or 5-fluorouracil, based on the quantitation of drug interactions in human HT29 colon cancer cells.Int J Oncol. 2002 Aug;21(2):361-7. Int J Oncol. 2002. PMID: 12118332
-
A peptide of SPARC interferes with the interaction between caspase8 and Bcl2 to resensitize chemoresistant tumors and enhance their regression in vivo.PLoS One. 2011;6(11):e26390. doi: 10.1371/journal.pone.0026390. Epub 2011 Nov 1. PLoS One. 2011. PMID: 22069448 Free PMC article.
-
SPARC in cancer biology: its role in cancer progression and potential for therapy.Drug Resist Updat. 2008 Dec;11(6):231-46. doi: 10.1016/j.drup.2008.08.005. Epub 2008 Oct 11. Drug Resist Updat. 2008. PMID: 18849185 Review.
-
Customizing chemotherapy for colon cancer: the potential of gene expression profiling.Drug Resist Updat. 2004 Jun;7(3):209-18. doi: 10.1016/j.drup.2004.05.001. Drug Resist Updat. 2004. PMID: 15296862 Review.
Cited by
-
Adaptive mechanisms of resistance to anti-neoplastic agents.Medchemcomm. 2016 Oct 21;8(1):53-66. doi: 10.1039/c6md00394j. eCollection 2017 Jan 1. Medchemcomm. 2016. PMID: 30108690 Free PMC article. Review.
-
A phase I trial of azacitidine and nanoparticle albumin bound paclitaxel in patients with advanced or metastatic solid tumors.Oncotarget. 2016 Dec 26;8(32):52413-52419. doi: 10.18632/oncotarget.14183. eCollection 2017 Aug 8. Oncotarget. 2016. PMID: 28881739 Free PMC article.
-
Associations of tumor suppressor SPARCL1 with cancer progression and prognosis.Oncol Lett. 2017 Sep;14(3):2603-2610. doi: 10.3892/ol.2017.6546. Epub 2017 Jul 8. Oncol Lett. 2017. PMID: 28927026 Free PMC article.
-
Analyses of the role of endogenous SPARC in mouse models of prostate and breast cancer.Clin Exp Metastasis. 2008;25(2):109-18. doi: 10.1007/s10585-007-9126-2. Epub 2007 Dec 5. Clin Exp Metastasis. 2008. PMID: 18058030 Free PMC article.
-
Radioresistance of glioma stem cells: intrinsic characteristic or property of the 'microenvironment-stem cell unit'?Mol Oncol. 2011 Aug;5(4):374-86. doi: 10.1016/j.molonc.2011.05.001. Epub 2011 May 20. Mol Oncol. 2011. PMID: 21659010 Free PMC article. Review.
References
-
- de las Alas MM, Aebi S, Fink D, Howell SB, Los G. Loss of DNA mismatch repair: effects on the rate of mutation to drug resistance. J. Natl. Cancer Inst. 1997;89:1537–1541. - PubMed
-
- Tang R, et al. p53 is an independent pre-treatment markers for long-term survival in stage II and III colorectal cancers: an analysis of interaction between genetic markers and fluorouracil-based adjuvant therapy. Cancer Lett. 2004;210:101–109. - PubMed
-
- Ahnen DJ, et al. Ki-ras mutation and p53 overexpression predict the clinical behavior of colorectal cancer: a Southwest Oncology Group study. Cancer Res. 1998;58:1149–1158. - PubMed
-
- Bunz F, et al. Requirement for p53 and p21 to sustain G2 arrest after DNA damage. Science. 1998;282:1497–1501. - PubMed
Publication types
MeSH terms
Substances
LinkOut - more resources
Full Text Sources
Other Literature Sources
Research Materials
Miscellaneous
