. 2005 Jun;115(6):1580-9.
doi: 10.1172/JCI19711. Epub 2005 May 2.

Antigen-specific CD4+ T cells drive airway smooth muscle remodeling in experimental asthma

Affiliations

Antigen-specific CD4+ T cells drive airway smooth muscle remodeling in experimental asthma

David Ramos-Barbón et al. J Clin Invest. 2005 Jun.

Abstract

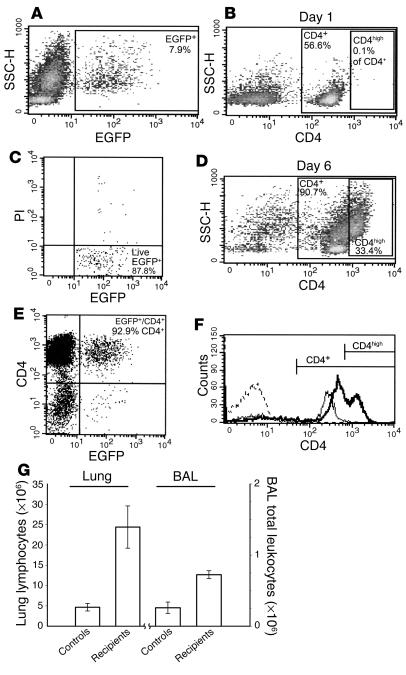
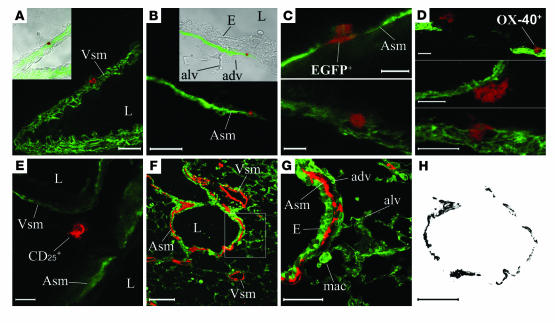
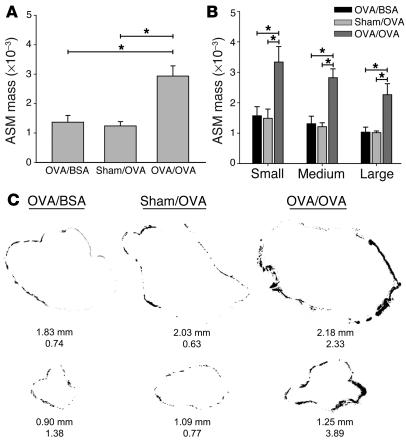
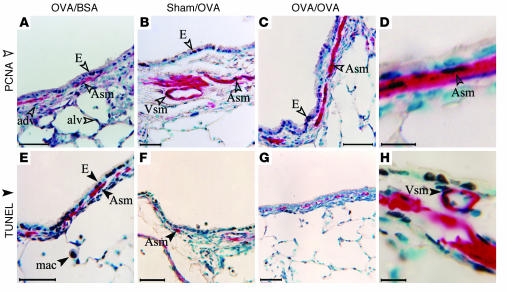
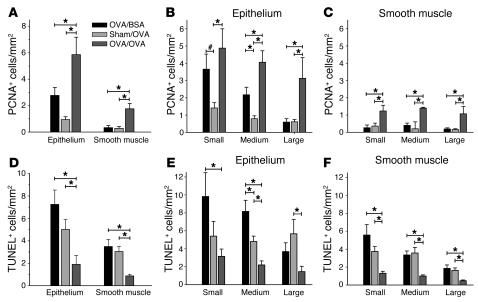
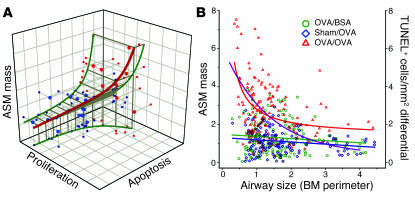
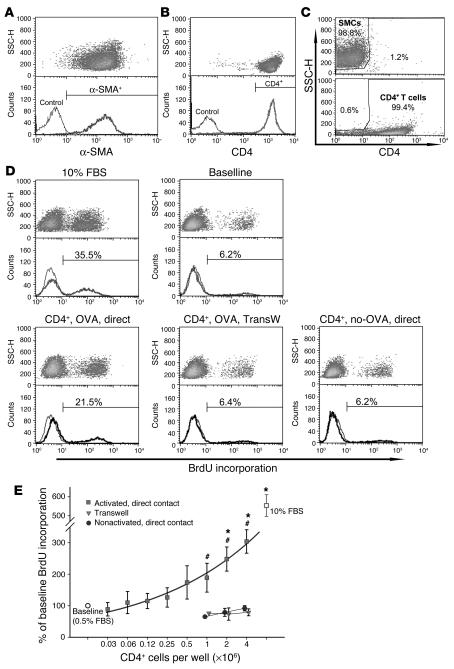
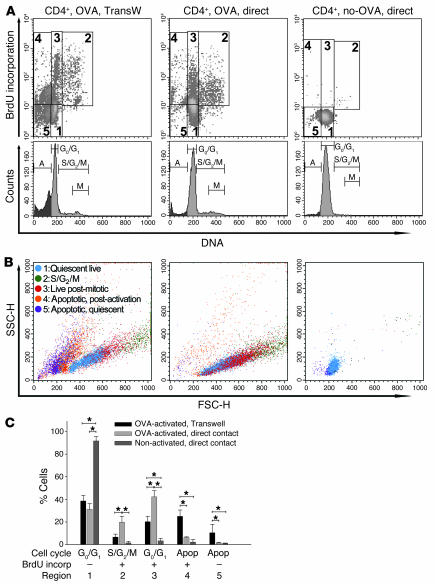
Airway smooth muscle (ASM) growth contributes to the mechanism of airway hyperresponsiveness in asthma. Here we demonstrate that CD4+ T cells, central to chronic airway inflammation, drive ASM remodeling in experimental asthma. Adoptive transfer of CD4+ T cells from sensitized rats induced an increase in proliferation and inhibition of apoptosis of airway myocytes in naive recipients upon repeated antigen challenge, which resulted in an increase in ASM mass. Genetically modified CD4+ T cells expressing enhanced GFP (EGFP) were localized by confocal microscopy in juxtaposition to ASM cells, which suggests that CD4+ T cells may modulate ASM cell function through direct cell-cell interaction in vivo. Coculture of antigen-stimulated CD4+ T cells with cell cycle-arrested ASM cells induced myocyte proliferation, dependent on T cell activation and direct T cell-myocyte contact. Reciprocally, direct cell contact prevented postactivation T cell apoptosis, which suggests receptor-mediated T cell-myocyte crosstalk. Overall, our data demonstrate that activated CD4+ T cells drive ASM remodeling in experimental asthma and suggest that a direct cell-cell interaction participates in CD4+ T cell regulation of myocyte turnover and induction of remodeling.


Figures

Figure 1
Figure 1
CD4+ T cell activation, retroviral transduction, and adoptive transfer of inflammatory responses. Total cell populations from sensitized lymph nodes were cultured with OVA and subsequently transduced with retroviruses encoding EGFP. (A) We identified the transduced cell population using EGFP as a selectable marker. (C) The EGFP+ cells exclude propidium iodide (PI) and are thus viable. (E) The majority of the EGFP+ cells are CD4+ T cells, which demonstrates selective transduction of this cell type. (B, D, and F) Stimulation with OVA led to progressive enrichment of CD4+ T cells in the cultured population as well as upregulation of CD4 expression from day 1 to day 6 (compare B and D). The data from B and D are presented as histograms in F. The thin line represents the CD4 distribution in the lymph node cell population as harvested from donors on day 1. The thick line represents the CD4 distribution following lymph node culture with OVA for 6 days. The dotted line represents the isotype control. (G) Following transduction, EGFP+ cells were sorted by FACS, and 2 × 10⁵ cells were transferred into unsensitized recipients that were subsequently airway challenged with OVA. Controls were recipients of EGFP+ cells challenged with vehicle or naive animals challenged with OVA. In recipients of EGFP+ cells, the absolute number of lung lymphocytes was increased 5-fold, and the absolute number of BAL leukocytes was increased 3-fold compared with controls. Data are from 2 independent experiments. Error bars represent range.
Figure 2
Figure 2
Confocal microscopy. (AE) Distribution of EGFP+ (AC), OX-40+ (D), and CD25+ (E) cells (red signal) relative to α-SMA (green signal). Insets in A and B show an overlay of the confocal sections over transmission histological images. (A) Example of an EGFP+ cell inside vascular smooth muscle (Vsm), likely exiting a small vessel (L, lumen). (BD) Confocal colocalization in 0.6-μm-thick optical sections suggesting direct contact between EGFP+ (B and C) or OX-40+ (D) cells and ASM (Asm). adv, adventitia; alv, alveolar walls; E, bronchial epithelium. (E) A CD25+ cell likely migrating between a vessel and a neighboring airway. (FH) Confocal extraction of ASM for quantitation. (F) In an airway, the smooth muscle bundles are identified by α-SMA immunostaining (red). The green signal corresponds to pan-actin (all actin isoforms), which was used as a general counterstain. (G) A high-magnification field (corresponding to the square in F) illustrates the airway epithelium, smooth muscle, adventitia, alveolar walls, and alveolar macrophages (mac). (H) The ASM bundles were isolated by confocal subtraction, to measure their surface area corrected by airway size. Scale bars: 100 μm (F and H); 50 μm (G); 20 μm (A and B); 10 μm (D and E); and 5 μm (C).
Figure 3
Figure 3
Quantitation of ASM mass. (A) An increase of ASM mass was induced in the group receiving CD4+ T cells purified from OVA-sensitized donors followed by repeated airway challenge with aerosolized OVA (OVA/OVA group) compared with BSA-challenged controls (OVA/BSA group) or controls that received CD4+ T cells from sham-sensitized donors and were challenged with OVA (sham/OVA group). (B) The CD4+ T cell–driven increase in ASM mass affected small (PBM < 1 mm), medium, and large (PBM ≥ 2 mm) airways. *P < 0.05. Error bars represent SE. (C) Illustrative examples of ASM, once subtracted by confocal microscopy. Airways of 2 different sizes are shown for each group. The numbers below each panel correspond to basement membrane length and ASM mass (dimensionless index, ×10–3).
Figure 4
Figure 4
Colocalization of PCNA and TUNEL with α-SMA. (AD) Detection of proliferating cells (PCNA+, open arrowheads). (EH) Detection of apoptotic cells (TUNEL+, filled arrowheads). Examples illustrating PCNA immunostaining and TUNEL, respectively, are shown for the OVA/BSA (A and E), sham/OVA (B and F), and OVA/OVA (C and G) groups. Both PCNA and TUNEL are shown as dark nuclear signals, colocalized with the α-SMA+ smooth muscle bundles (red cytoplasmic signal). D and H illustrate at high magnification the colocalization of PCNA and TUNEL, respectively, with α-SMA. PCNA+ and apoptotic cells can also be identified in the airway epithelium, in vascular smooth muscle of bronchial arterioles, and other locations as indicated. Counterstain: methyl green. Scale bars: 50 μm (AC and EG); 10 μm (D and H).
Figure 5
Figure 5
Quantitative morphology of cell proliferation and apoptosis in airways. (A and D) Mean PCNA+ and TUNEL+ cells per millimeter2, respectively, by experimental group. (B and E) Mean epithelial PCNA+ and TUNEL+ cells per millimeter2, respectively, by airway size and experimental group. (C and F) Mean epithelial PCNA+ and TUNEL+ cells per millimeter2, respectively, in ASM cells. Error bars represent SE. *P < 0.05, post-ANOVA; #statistically borderline difference with power less than 80%.
Figure 6
Figure 6
Regression analysis of the increase in ASM mass as a dual function of increased proliferation and decreased apoptosis of ASM cells. (A) Tri-variable projections and 3D reconstruction (a detailed split is shown in Supplemental Figure S1). The control groups were pooled and are represented as blue spheres for clarity. (B) Scatter plot of ASM mass (×10–3) versus airway size. The relative amount of ASM is approximately constant along the tracheobronchial tree (green and blue, OVA/BSA and sham/OVA groups, respectively). The CD4+ T cell–driven effect on ASM mass lifts and distorts this relationship (red, OVA/OVA group). The increase in ASM mass is greater the smaller the airways. The airway size also influences the effect on regulation of apoptosis; the size of the decrements in myocyte apoptosis frequency is greater the smaller the airways (TUNEL differential, right y axis, violet regression curve). The influence of the airway size on apoptosis inhibition and ASM mass followed similar regression trends, whereas there was no relationship between airway size and PCNA+ cell frequency (data not shown). BM, basement membrane.
Figure 7
Figure 7
CD4+ T cells induce airway myocyte proliferation, dependent on T cell activation and direct T cell–myocyte contact. (A) Ninety-nine percent of the cells in primary ASM cell cultures expressed α-SMA. (B) CD4+ T cells (purity ≥ 98%) were cocultured with the ASM cells for 48 hours, in the presence of BrdU during the last 24 hours. Cells were immunostained for CD4, and BrdU incorporation by the ASM cells was quantified. (C) The CD4+ T cells and the smooth muscle cells (SMCs) were resolved with at least 99% specificity, as calculated from samples containing ASM cells only (upper plot) or T cells only recovered from Transwells (lower plot). In the lower plot, the left-shifted tail of the T cell population reflects some loss of CD4 expression from apoptosis. (D) BrdU incorporation by ASM cells. In each panel, BrdU incorporation is represented as a density plot (upper plots) and as a histogram (lower plots, thick line) overlaid on the baseline histogram (thin lines). The percentages of BrdU+ cells were calculated by subtraction. Myocytes incubated with 10% FBS served as a positive control for proliferation. The baseline BrdU incorporation was calculated from myocytes cultured in 0.5% FBS and 20 U/ml IL-2. The ASM cells were cocultured with: CD4+ T cells activated with OVA, either in direct contact (CD4+, OVA, direct) or separated by a Transwell membrane (CD4+, OVA, TransW); and with nonstimulated CD4+ T cells in direct contact (CD4+, no-OVA, direct). Coculture in direct contact with OVA-activated T cells elicited a significant increase in BrdU incorporation. (E) Dose-response curve of T cell effect on myocyte BrdU incorporation. Data normalized as percentage of baseline. n = 3–6 independent experiments per data point. *P < 0.05 versus baseline; #P < 0.05 versus Transwell and nonactivated T cells.
Figure 8
Figure 8
Inhibition of CD4+ T cell apoptosis by direct T cell–ASM cell contact indicates bidirectional crosstalk. Purified OVA-stimulated CD4+ T cells were cocultured for 48 hours with ASM cells either separated in Transwells or in direct contact. Additionally, CD4+ T cells were cocultured in contact with the ASM cells without prior stimulation in vitro. The cocultures were exposed to BrdU for 24 hours and the CD4+ T cells analyzed for BrdU incorporation and total cell DNA content. (A) BrdU versus DNA density plots shown with the corresponding DNA histograms. T cell BrdU incorporation plotted against DNA content defines the following regions: 1, live quiescent cells (absence of BrdU incorporation and in G0/G1 phase of the cell cycle); 2, cells undergoing proliferation (incorporation of BrdU and in S or G2/M phases of the cell cycle); 3, live postmitotic cells (incorporation of BrdU and again in G0/G1 phase of the cell cycle); 4, postactivation apoptotic cells (incorporation of BrdU and subdiploid DNA content); and 5, apoptotic quiescent cells (no BrdU incorporation and subdiploid DNA content). “A” in the DNA histograms corresponds to the subdiploid or sub-G0/G1 region and represents both quiescent and postactivation apoptotic T cells. M, cells in mitosis. (B) The corresponding side (SSC-H) versus forward (FSC-H) scatter dot plots are multicolor gated in the BrdU/DNA density plot regions defined in A. (C) Quantitative analysis of the cytometric regions defined in A and B. Data are from 4 independent experiments. *P < 0.05. Apop, apoptotic cells; incorp, incorporation.

References

    1. Bousquet J, Jeffery PK, Busse WW, Johnson M, Vignola AM. Asthma. From bronchoconstriction to airways inflammation and remodeling. Am. J. Respir. Crit. Care Med. 2000;161:1720–1745. - PubMed
    1. Elias JA, et al. New insights into the pathogenesis of asthma. J. Clin. Invest. 2003;111:291–297. doi:10.1172/JCI200317748. - PMC - PubMed
    1. James AL, Pare PD, Hogg JC. The mechanics of airway narrowing in asthma. Am. Rev. Respir. Dis. 1989;139:242–246. - PubMed
    1. Lambert RK, Wiggs BR, Kuwano K, Hogg JC, Pare PD. Functional significance of increased airway smooth muscle in asthma and COPD. J. Appl. Physiol. 1993;74:2771–2781. - PubMed
    1. Robinson DS, et al. Predominant TH2-like bronchoalveolar T-lymphocyte population in atopic asthma. N. Engl. J. Med. 1992;326:298–304. - PubMed

Publication types

MeSH terms