

Simultaneous inference of selection and population growth from patterns of variation in the human genome
- PMID: 15905331
- PMCID: PMC1142382
- DOI: 10.1073/pnas.0502300102
Simultaneous inference of selection and population growth from patterns of variation in the human genome
Abstract
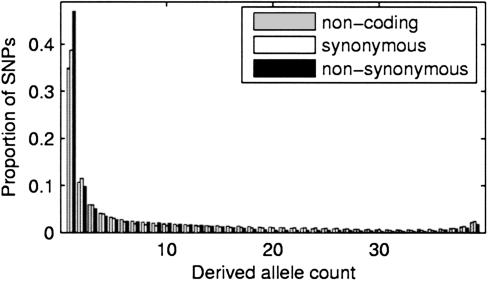
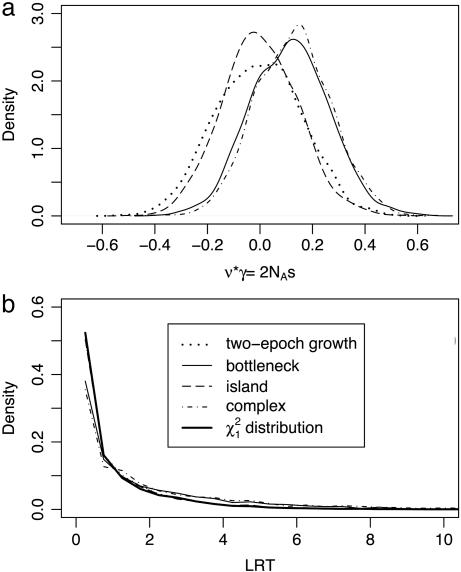
Natural selection and demographic forces can have similar effects on patterns of DNA polymorphism. Therefore, to infer selection from samples of DNA sequences, one must simultaneously account for demographic effects. Here we take a model-based approach to this problem by developing predictions for patterns of polymorphism in the presence of both population size change and natural selection. If data are available from different functional classes of variation, and a priori information suggests that mutations in one of those classes are selectively neutral, then the putatively neutral class can be used to infer demographic parameters, and inferences regarding selection on other classes can be performed given demographic parameter estimates. This procedure is more robust to assumptions regarding the true underlying demography than previous approaches to detecting and analyzing selection. We apply this method to a large polymorphism data set from 301 human genes and find (i) widespread negative selection acting on standing nonsynonymous variation, (ii) that the fitness effects of nonsynonymous mutations are well predicted by several measures of amino acid exchangeability, especially site-specific methods, and (iii) strong evidence for very recent population growth.
Figures
References
Publication types
MeSH terms
Grants and funding
LinkOut - more resources
Full Text Sources
Other Literature Sources
