Comparative Study
. 2005 May 31;102(22):7916-21.
doi: 10.1073/pnas.0409720102. Epub 2005 May 19.

Characterization of subsets of CD4+ memory T cells reveals early branched pathways of T cell differentiation in humans

Affiliations
Comparative Study

Characterization of subsets of CD4+ memory T cells reveals early branched pathways of T cell differentiation in humans

Kaimei Song et al. Proc Natl Acad Sci U S A. .

Abstract

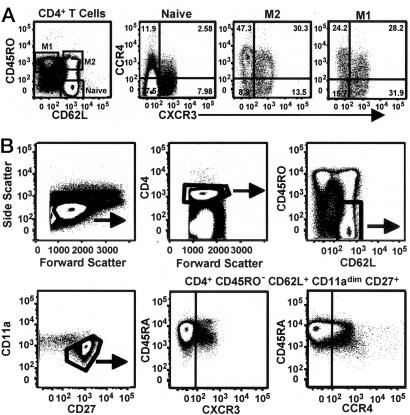
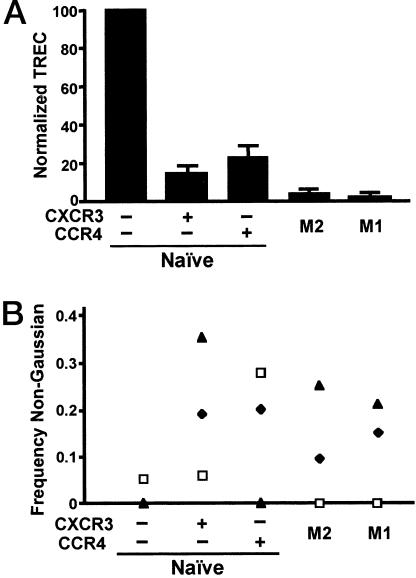
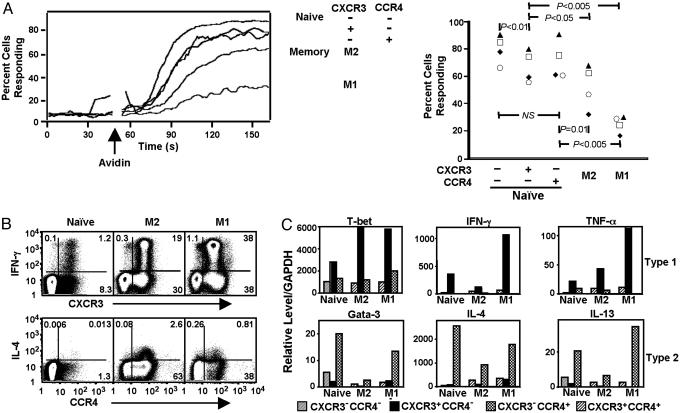
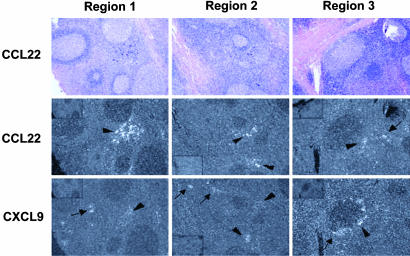
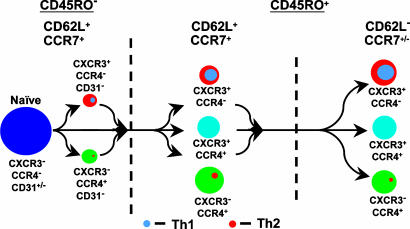
The pathways for differentiation of human CD4(+) T cells into functionally distinct subsets of memory cells in vivo are unknown. The identification of these subsets and pathways has clear implications for the design of vaccines and immune-targeted therapies. Here, we show that populations of apparently naive CD4(+) T cells express the chemokine receptors CXCR3 or CCR4 and demonstrate patterns of gene expression and functional responses characteristic of memory cells. The proliferation history and T cell receptor repertoire of these chemokine-receptor(+) cells suggest that they are very early memory CD4(+) T cells that have "rested down" before acquiring the phenotypes described for "central" or "effector" memory T cells. In addition, the chemokine-receptor(+) "naive" populations contain Th1 and Th2 cells, respectively, demonstrating that Th1/Th2 differentiation can occur very early in vivo in the absence of markers conventionally associated with memory cells. We localized ligands for CXCR3 and CCR4 to separate foci in T cell zones of tonsil, suggesting that the chemokine-receptor(+) subsets may be recruited and contribute to segregated, polarized microenvironments within lymphoid organs. Importantly, our data suggest that CD4(+) T cells do not differentiate according to a simple schema from naive --> CD45RO(+) noneffector/central memory --> effector/effector memory cells. Rather, developmental pathways branch early on to yield effector/memory populations that are highly heterogeneous and multifunctional and have the potential to become stable resting cells.


Figures

Fig. 1.
Fig. 1.
CCR4 and CXCR3 are expressed on naïve CD4+ T cell subsets from adult blood. (A) PBMCs were stained with anti-CD4-Cy7APC, anti-CD45RA-Qdot 655 (data not shown), anti-CD45RO-cascade blue, anti-CD62L-Cy5.5APC, anti-CXCR3-FITC, and anti-CCR4-PE. Only CD4+ cells with the scatter profile of lymphocytes are shown. Cells within the naïve, M2, and M1 subsets (see text for details) in the left-most dot plot are shown to the right with staining for CXCR3 and CCR4. Quadrant boundaries for CXCR3 and CCR4 were set based on samples stained with all antibodies except either anti-CXCR3 or anti-CCR4. Similar results were obtained by using a variety of staining protocols and cells from >30 donors. (B) PBMCs were stained with anti-CD4-Alexa Fluor 680, anti-CD45RO-Texas red-PE, anti-CD62L-cascade blue, anti-CD11a-Cy7APC, anti-CD27-APC, anti-CD45RA-Qdot 655, anti-CXCR3-FITC, and anti-CCR4-PE. The dot plots show sequential gating to eliminate nonnaïve cells. As shown, all of the CD4+CD45ROCD62L+CD11adimCD27+T cells are CD45RA+, although levels of CD45RA are variable. Similar results were obtained with cells from five donors.
Fig. 2.
Fig. 2.
NR+ cells have intermediate numbers of TREC and a memory-population-like TCR repertoire. (A) Purified CD4+ T cells were stained with anti-CD4-cascade blue, anti-CD3-Cy7PE, anti-CD45RA-Ax594, anti-CD45RO-APC, anti-CD62L-Cy7APC, anti-CXCR3-FITC, and anti-CCR4-PE and anti-CD8-Cy5PE, anti-CD14-Cy5PE, anti-CD16-Cy5PE, anti-CD20-Cy5PE, and anti-CD56-Cy5PE (for the “dump” channel) and sorted into five populations. Naïve, M2, and M1 cells are as defined for Fig. 1 A. TREC numbers were calculated per 105 cells, and the values for receptor naïve cells were normalized to 100 to allow data from six donors to be combined. Error bars show SEM. Paired t tests done on the normalized numbers showed P < 0.05 for comparisons between each subset of NR+ cells vs. receptor naïve and vs. M2, and for M2 vs. M1. (B) Purified CD4+ T cells were stained with anti-CD4-Cy5PE, anti-CD45RO-APC, anti-CD62L-Cy5.5APC, anti-CXCR3-FITC, and anti-CCR4-PE and sorted into five populations. Electrophoretograms were scored as Gaussian-like or non-Gaussian-like, as described in Materials and Methods. Frequencies of non-Gaussian-like electrophoretograms in subsets from an individual donor are identified with a unique symbol. χ2 analysis of the frequencies obtained by summing the data for each subset for all donors gave P < 0.01 for each subset vs. receptor naïve (significant by using the Bonferroni correction) but P > 0.05 for other pairwise comparisons. These frequencies correspond to 1 of 61, 11 of 55, 9 of 59, 4 of 47, and 6 of 57 informative electrophoretograms, respectively, for the populations, from left to right.
Fig. 3.
Fig. 3.
NR+ cells show responses that are not naïve. (A) PBMCs isolated from whole blood were loaded with indo-1 AM ester, stained with anti-CD4-Cy7APC, anti-CD45RO-APC, anti-CD45RA-cascade blue, anti-CD62L-Cy7PE, anti-CXCR3-FITC, and anti-CCR4-PE and anti-CD8-Cy5PE, anti-CD14-Cy5PE, and anti-CD20-Cy5PE (for the dump channel), and incubated with biotin-conjugated anti-CD3. The intracellular calcium-concentration-sensitive ratio of 405/20-nm:525/20-nm emissions was measured on the flow cytometer before and after avidin-induced CD3 cross-linking and analyzed on subsets of cells defined by gating. (Left) Within each subset for a single collection, the running means of percentages of cells vs. time having a ratio of violet/blue above a threshold that was set at the 95th percentile for the cells collected before the addition of avidin is shown. (Right) The averages of the running means obtained over the 25 s beginning with the time of peak response for the subsets from four donors in a single experiment are shown. Subsets from an individual collection/donor are identified with a unique symbol. Ps were obtained from paired t tests between groups. Similar results were obtained in two additional experiments. (B) Purified CD4+ T cells were stained with anti-CD62L-FITC, anti-CD4-Cy5PE, and anti-CD45RO-Cy7APC, separated into CD4+ naïve, M2, and M1 subsets by FACS, stained with anti-CXCR3-PE or anti-CCR4-PE, activated with PMA and ionomycin in the presence of monensin, and stained with anti-IL-4-APC or anti-IFN-γ-APC. These data are representative of two donors. Similar results were obtained in six additional experiments by using a variety of staining protocols but without purifying cells by FACS. (C) Cells were stained as for Fig. 2 A. FACS-purified populations were activated with PMA and ionomycin, and relative levels of mRNAs were determined by using real-time RT-PCR. The small subsets of naïve CXCR3+CCR4+ and M2/M1 CXCR3CCR4 cells were not analyzed. Values are means of duplicate measurements of single samples. Values were assigned by reference to samples from cell lines and cannot be compared between different species of mRNA. Similar results were obtained with cells from three donors.
Fig. 4.
Fig. 4.
CCL22 and CXCL9 are expressed in adjacent foci in tonsil. 35S-labeled RNA probes for CCL22 and CXCL9 were hybridized to serial sections of paraffin-embedded tonsil tissue. Three regions of the tissue sample, stained with hematoxylin and eosin, are shown at ×50 magnification. Bright-field illumination is shown in the first row and dark-field illumination in the second and third rows. For each region, the images in the first and second rows show results with the antisense CCL22 probe, and the image in the last row shows results from an adjacent section with the antisense CXCL9 probe. Insets in the corners of the dark-field views for regions 1 and 3 (Top Left) and region 2 (Bottom Left) show controls for each section with the CCL22 or CXCL9 sense probes. Developed grains appear black on bright-field images and white on dark-field images. The bright-field views show multiple germinal centers separated by T cell zones. In the dark-field views for each region, the arrowheads indicate foci where signals for CCL22 and CXCL9 are adjacent, and the arrows indicate foci of signal for one mRNA species without adjacent foci for the other. Different tissue sections from this tonsil hybridized to CXCL9 probes are published in ref. .
Fig. 5.
Fig. 5.
CXCR3 and CCR4 in CD4+ T cell differentiation. Populations of resting CD4+ T cells are depicted based on the expression of CD45RO, CD62L, CXCR3, and CCR4. Expression of CCR7 and CD31 are also noted, based on our work (data not shown). All CD45RO+ cells are gCD31 (not depicted). Disk sizes were drawn to approximate the relative proportions of the populations in adult blood. The gray and orange discs represent Th1 and Th2 subsets, which are found principally in the CXCR3+CCR4 and CXCR3CCR4+ populations, respectively. We hypothesize that the CD4+ T cell subsets consist of cells that have come to rest at different points along the pathway of effector cell activation and progressive differentiation from CD45ROCD62L+ to CD45RO+CD62L+ to CD45RO+CD62L, as indicated by the arrows. The small subsets of CD45ROCD62L+CXCR3+CCR4+ and CD45RO+CXCR3CCR4 cells, which we did not analyze, are omitted. Additional arrows are not drawn between subsets both for the sake of clarity and because the precise precursor–product relationships among the subsets are not known.

References

    1. Kaech, S. M., Wherry, E. J. & Ahmed, R. (2002) Nat. Rev. Immunol. 2, 251–262. - PubMed
    1. Seder, R. A. & Ahmed, R. (2003) Nat. Immunol. 4, 835–842. - PubMed
    1. Sallusto, F., Lenig, D., Forster, R., Lipp, M. & Lanzavecchia, A. (1999) Nature 401, 708–712. - PubMed
    1. Sallusto, F., Geginat, J. & Lanzavecchia, A. (2004) Annu. Rev. Immunol. 22, 745–763. - PubMed
    1. Yamamoto, J., Adachi, Y., Onoue, Y., Adachi, Y. S., Okabe, Y., Itazawa, T., Toyoda, M., Seki, T., Morohashi, M., Matsushima, K. & Miyawaki, T. (2000) J. Leukocyte Biol. 68, 568–574. - PubMed

Publication types