. 2005 Jul;3(7):e201.
doi: 10.1371/journal.pbio.0030201. Epub 2005 May 24.

A role for adenosine deaminase in Drosophila larval development

Affiliations

A role for adenosine deaminase in Drosophila larval development

Tomas Dolezal et al. PLoS Biol. 2005 Jul.

Abstract

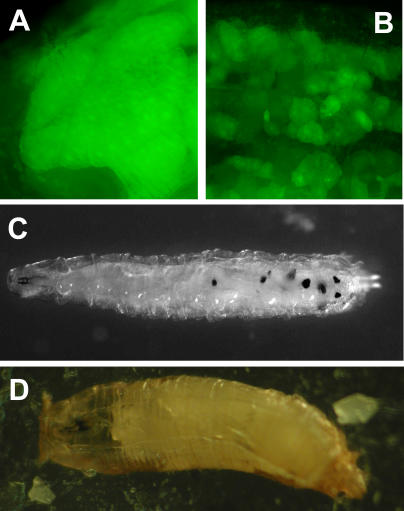
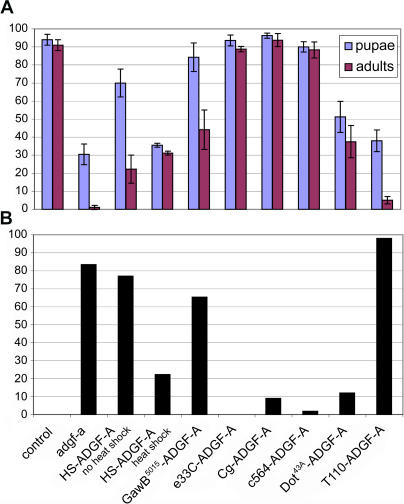
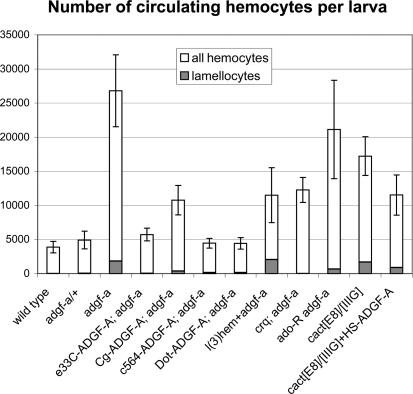
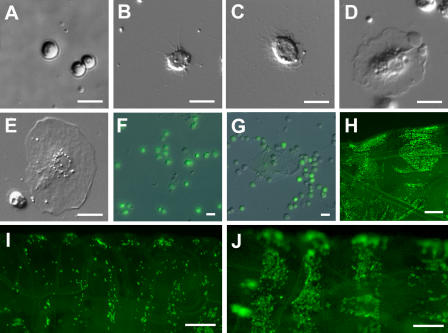
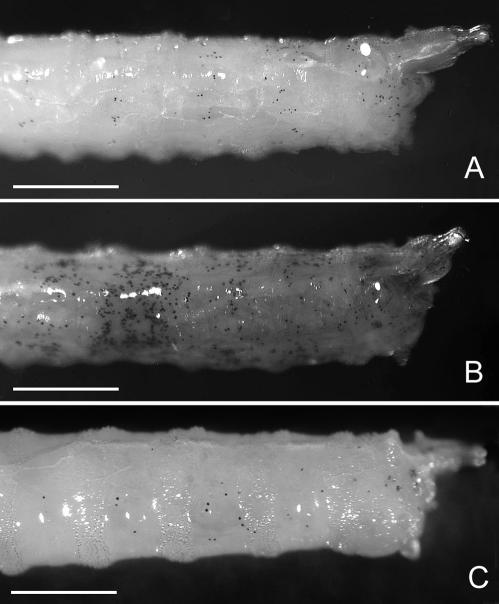
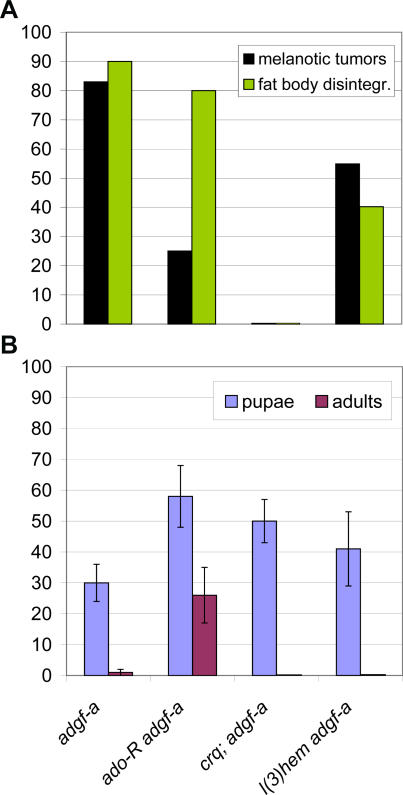
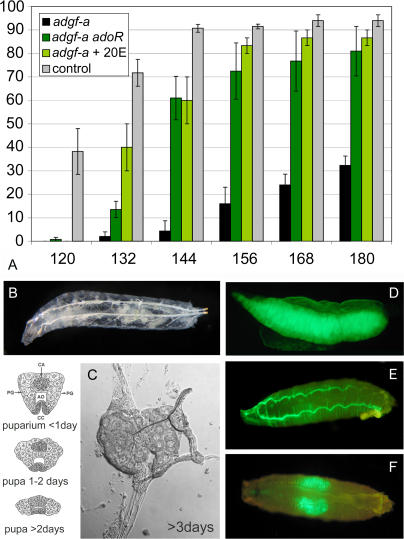
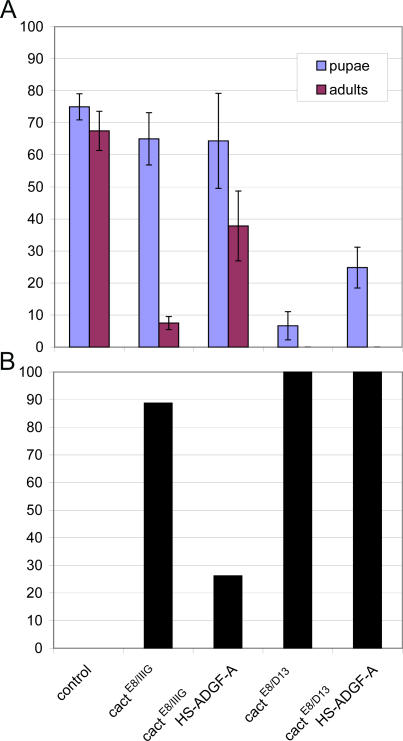
Adenosine deaminase (ADA) is an enzyme present in all organisms that catalyzes the irreversible deamination of adenosine and deoxyadenosine to inosine and deoxyinosine. Both adenosine and deoxyadenosine are biologically active purines that can have a deep impact on cellular physiology; notably, ADA deficiency in humans causes severe combined immunodeficiency. We have established a Drosophila model to study the effects of altered adenosine levels in vivo by genetic elimination of adenosine deaminase-related growth factor-A (ADGF-A), which has ADA activity and is expressed in the gut and hematopoietic organ. Here we show that the hemocytes (blood cells) are the main regulator of adenosine in the Drosophila larva, as was speculated previously for mammals. The elevated level of adenosine in the hemolymph due to lack of ADGF-A leads to apparently inconsistent phenotypic effects: precocious metamorphic changes including differentiation of macrophage-like cells and fat body disintegration on one hand, and delay of development with block of pupariation on the other. The block of pupariation appears to involve signaling through the adenosine receptor (AdoR), but fat body disintegration, which is promoted by action of the hemocytes, seems to be independent of the AdoR. The existence of such an independent mechanism has also been suggested in mammals.


Figures

Figure 1
Figure 1. adgf-a Mutant Phenotype
(A and B) Fat body disintegration visualized by GFP expression driven by Cg-Gal4 driver in the fat body. While adgf-a/+ heterozygous third instar larvae have normal flat layers of fat body (A),adgf-a mutant showed extensive fat body disintegration into small pieces of tissue (B). (C) Multiple melanotic tumors present in adgf-a mutant third-instar larva. (D) An adgf-a mutant pupa with typical abdominal curvature.
Figure 2
Figure 2. Rescue of the adgf-a Mutant Phenotype by Expression of ADGF-A in Different Tissues
(A) Percentage of pupae (blue bars) and adult flies (purple bars) demonstrating the larval and pupal survival, respectively, of the adgf-a mutant flies rescued by expression of transgenic ADGF-A in different tissues. Along the x-axis (which is shared with [B]), the rescue experiments are shown (marked by the Gal4 driver used for expression of ADGF-A except for first three sets of bars—the first set presents only an adgf-a mutant, the second an adgf-a mutant carrying HS-ADGF-A construct without heat shock, and the third with heat shock) and the y-axis represents percentage of pupae and adult flies out of the total number of transferred first-instar larvae of particular genotype. Each experiment was repeated at least four times (with 20–30 animals in each vial) and the standard error is shown. (B) Percentage of late third-instar larvae with melanotic tumors. The x-axis is shared with (A) (described above). The y-axis shows the percentage of larvae with tumors out of all larvae of each genotype examined for (A).
Figure 3
Figure 3. Number of Circulating Hemocytes in Late Third-Instar Larvae
Genotypes are shown along the x-axis, and the number of hemocytes/larva along the y-axis. Each bar shows the number of all circulating hemocytes, and the gray part of the bars represent the lamellocyte population. Each count was repeated five to ten times and the standard error is shown.
Figure 4
Figure 4. Hemocyte Abnormalities in adgf-a Mutant Larvae
(A–E) Differential interference contrast microscopy of living circulating hemocytes (magnification 200×; scale bar, 10 μm). Round, nonadhesive plasmatocytes from wild-type larva (A). Hemocytes from the adgf-a mutant developing filamentous extensions (B and C) or membranous extension surrounding the cell (D). Large flat lamellocyte from the adgf-a mutant (E). (F and G) Differential interference contrast and fluorescent microscopy (merged image) of living circulating hemocytes stained by the Hml-GFP marker (magnification 100×; scale bar, 10 μm). While most of the cells from wild-type larvae are GFP-positive (F), just few of the cells from late third instar adgf-a larvae are stained by GFP at this stage (G). (H–J) Fluorescence microscopy of living larvae with Hml-GFP stained hemocytes (magnification 40×; scale bar, 100 μm). Posterior part of late third-instar wild-type larva (H). Middle sections of early third-instar larvae of wild type (I) and adgf-a mutant (J).
Figure 5
Figure 5. Crystal Cells in Late Third Instar Larvae
Crystal cells were visualized by heating larvae of different genotypes at 60 °C for 10 min [46]. (A) Wild-type larva, (B) adgf-a single mutant, (C) adoR adgf-a double mutant (scale bar, 0.5 mm).
Figure 6
Figure 6. Suppression of the adgf-a Mutant Phenotype by Mutations in Other Genes
(A) Percentage of late third-instar larvae with melanotic tumors (black bars) and fat body disintegration (green bars). The x-axis (which is shared with [B]), shows the genotype. The y-axis shows the percentage of larvae with tumors and fat body disintegration. (B) Survival rate of double mutants compared to single adgf-a mutant. The y-axis shows the percentage of the pupae (blue bars) and adult flies (purple bars) demonstrating the larval and pupal survival, respectively. Each experiment was repeated at least four times (with 20–30 animals in each vial) and the standard error is shown.
Figure 7
Figure 7. Ecdysone Regulation of Development in adgf-a
(A) Larvae of different genotypes were collected after L2/L3 molt, and the number of puparia was counted at different time points (x-axis: hours after egg laying). The y-axis shows the percentage of puparia out of all collected third-instar larvae (three vials each with 30 animals; the standard error is shown). (B and C) Ring gland morphology in arrested adgf-a larvae. Approximately 8-d old mutant larva (i.e., 3 d after normal pupariation) with very extensive fat body disintegration (note the transparency of larva in the middle part with small white pieces of fat body) (B). The ring gland dissected from this larva (C) shows morphology of the normal ring gland before the degenerative changes of prothoracic gland starts (compare to schematic diagram to the left of [C], from [28]). (D–F) Expression of GFP-marked glue protein (SgsΔ3-GFP) in salivary gland of the adgf-a mutant larvae and pupae. All late third-instar larvae express the glue protein as shown on dissected salivary gland (D). Some mutants show typical expulsion from the glands with GFP totally external to the puparial case (E), while others do not expel glue proteins even after puparium formation (F).
Figure 8
Figure 8. Genetic Interactions of Toll Signaling and ADGF-A
Survival rate and melanotic tumor formation were compared in mutants in the Toll signaling pathway and in similar mutants with overexpression of ADGF-A using the HS-ADGF-A construct. (A) The bar graph shows the percentage of the pupae (blue bars) and adult flies (purple bars) demonstrating the larval and pupal survival of each genotype. The x-axis shows the genotypes and is shared with (B). Flies heterozygous for the cact mutation were used as a control. (B) Percentage of late third instar larvae presenting melanotic tumor formation.
Figure 9
Figure 9. Schematic Map of the ADGF-A Gene with Promoter Analysis
The ADGF-A gene contains four exons and two transcriptional starts [17,47]. We analyzed sequences preceding both transcriptional starts for the presence of known transcriptional factor binding sites using the software program Gene2Promoter (Genomatix Software GmbH). Selected sites are represented by color bars in approximate positions of promoter regions. The legend under the sequence show the names of transcription factors binding to matching colored binding sites.

References

    1. Aldrich MB, Blackburn MR, Kellems RE. The importance of adenosine deaminase for lymphocyte development and function. Biochem Biophys Res Commun. 2000;272:311–315. - PubMed
    1. Buckley RH, Schiff RI, Schiff SE, Markert ML, Williams LW. Human severe combined immunodeficiency: Genetic, phenotypic, and functional diversity in one hundred eight infants. J Pediatr. 1997;130:378–387. - PubMed
    1. Richard E, Alam SM, Arredondo-Vega FX, Patel DD, Hershfield MS. Clustered charged amino acids of human adenosine deaminase comprise a functional epitope for binding the adenosine deaminase complexing protein CD26/dipeptidyl peptidase IV. J Biol Chem. 2002;277:19720–19726. - PubMed
    1. Latini S, Pedata F. Adenosine in the central nervous system: Release mechanisms and extracellular concentrations. J Neurochem. 2001;79:463–484. - PubMed
    1. Hershfield MS, Mitchell BS. Immunodeficiency diseases caused by adenosine deaminase deficiency and purine nucleoside phosphorylase deficiency. In: Vogelstein B, editor. The metabolic and molecular bases of inherited disease. New York: McGraw-Hill; 2001. pp. 2585–2611.

Publication types

MeSH terms

Associated data