. 2005 May 20:6:75.
doi: 10.1186/1471-2164-6-75.

Control of gene expression during T cell activation: alternate regulation of mRNA transcription and mRNA stability

Affiliations

Control of gene expression during T cell activation: alternate regulation of mRNA transcription and mRNA stability

Chris Cheadle et al. BMC Genomics. .

Abstract

Background: Microarray technology has become highly valuable for identifying complex global changes in gene expression patterns. The effective correlation of observed changes in gene expression with shared transcription regulatory elements remains difficult to demonstrate convincingly. One reason for this difficulty may result from the intricate convergence of both transcriptional and mRNA turnover events which, together, directly influence steady-state mRNA levels.

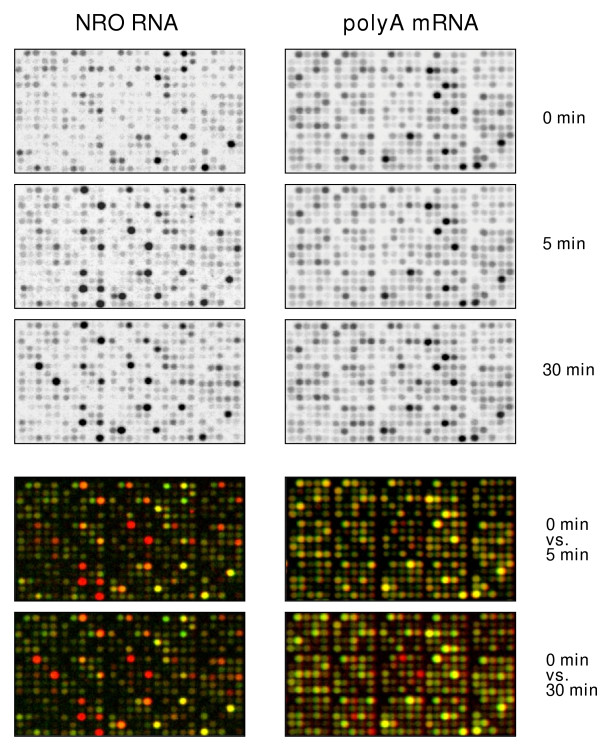
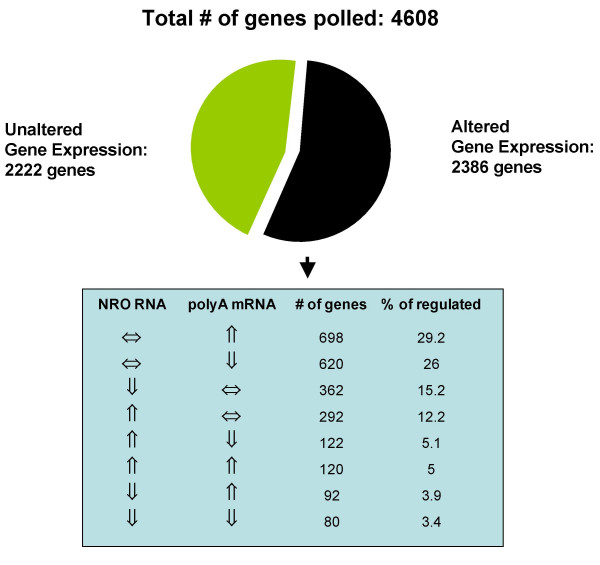
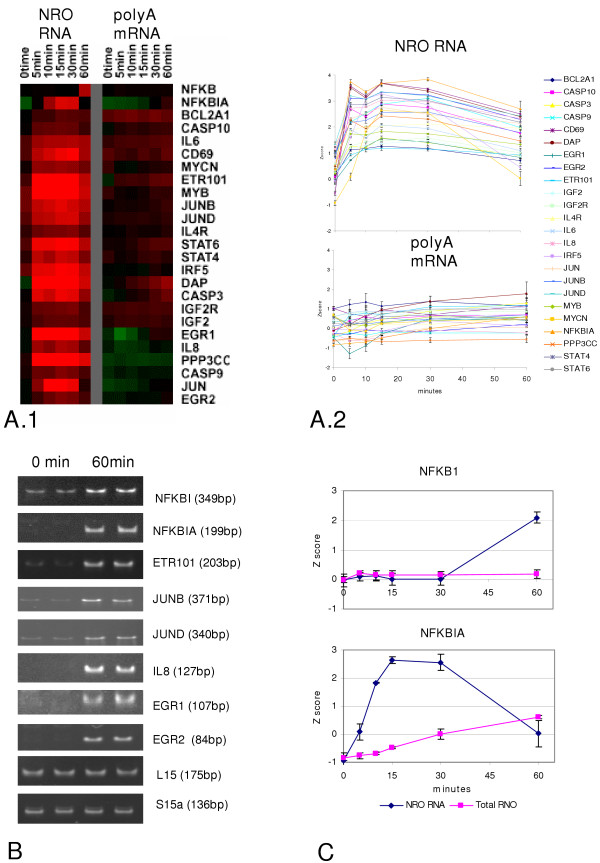
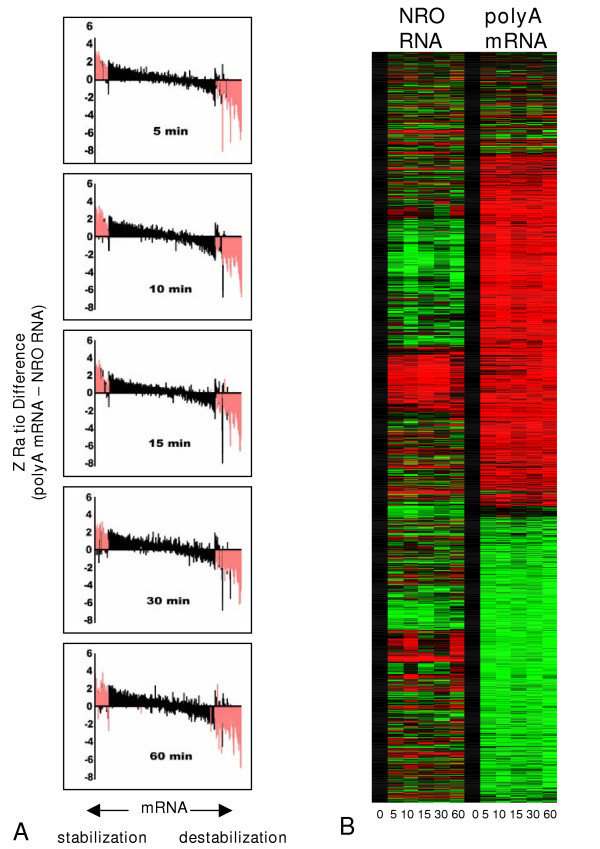
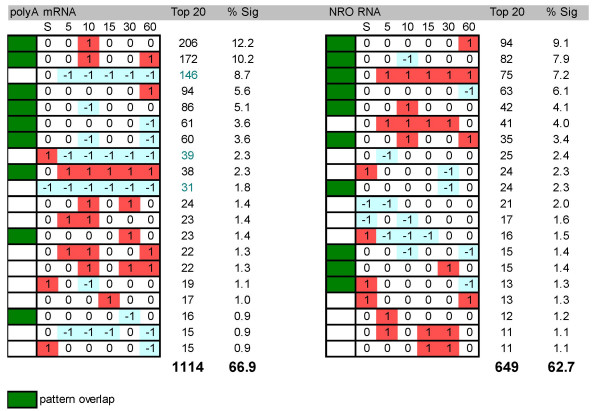
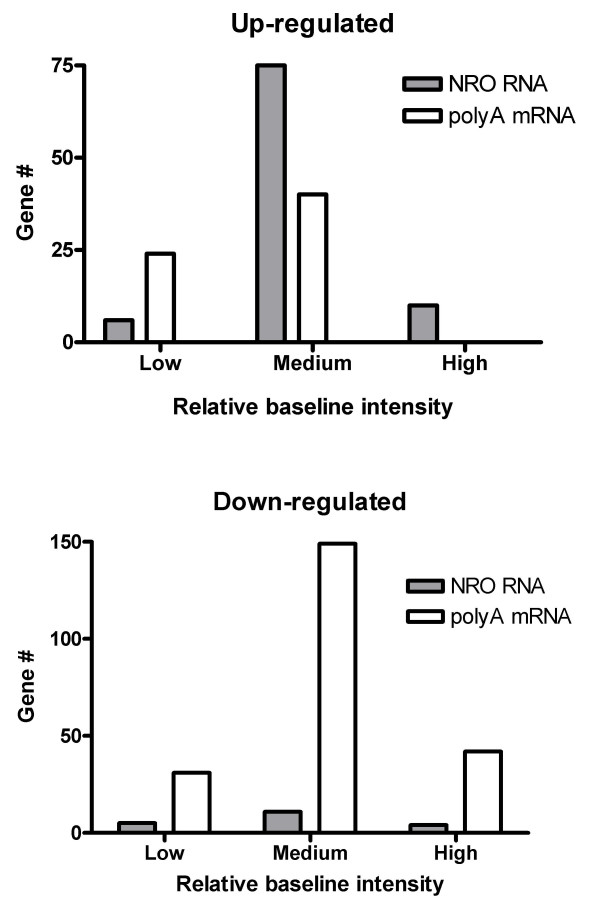
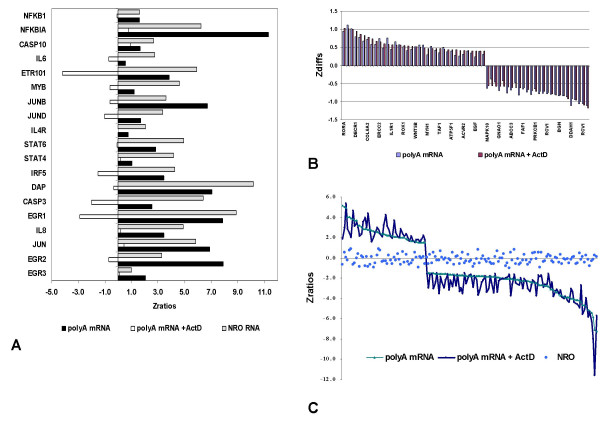
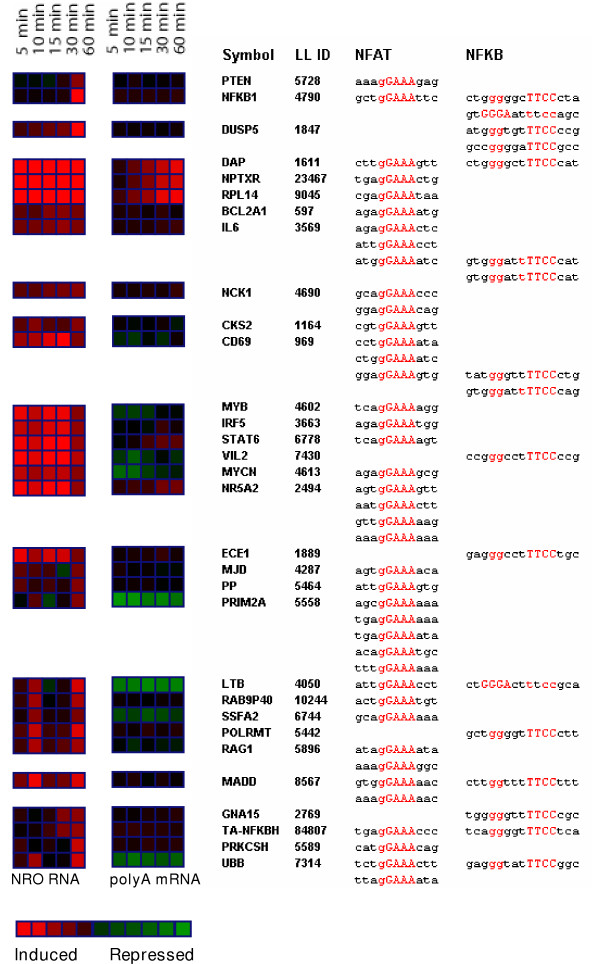
Results: In order to investigate the relative contribution of gene transcription and changes in mRNA stability regulation to standard analyses of gene expression, we used two distinct microarray methods which individually measure nuclear gene transcription and changes in polyA mRNA gene expression. Gene expression profiles were obtained from both polyA mRNA (whole-cell) and nuclear run-on (newly transcribed) RNA across a time course of one hour following the activation of human Jurkat T cells with PMA plus ionomycin. Comparative analysis revealed that regulation of mRNA stability may account for as much as 50% of all measurements of changes in polyA mRNA in this system, as inferred by the absence of any corresponding regulation of nuclear gene transcription activity for these groups of genes. Genes which displayed dramatic elevations in both mRNA and nuclear run-on RNA were shown to be inhibited by Actinomycin D (ActD) pre-treatment of cells while large numbers of genes regulated only through altered mRNA turnover (both up and down) were ActD-resistant. Consistent patterns across the time course were observed for both transcribed and stability-regulated genes.

Conclusion: We propose that regulation of mRNA stability contributes significantly to the observed changes in gene expression in response to external stimuli, as measured by high throughput systems.


Figures

Figure 1
Figure 1
Hybridization images of polyA mRNA and nuclear run-on (NRO) RNA. Depicted are signals in fields of arrays corresponding to untreated (time 0), as well as 5, and 30 min after induction of Jurkat cells using 40 ng/ml PMA and 1 μM Ionomycin (P+I). Two-color overlays contrast either 5 min or 30 min (red) versus 0 (green) for polyA mRNA and NRO RNAs.
Figure 2
Figure 2
Distributions of significantly regulated genes in both polyA mRNA and nuclear run-on (NRO) RNA. For this analysis, a gene was considered to be up- or down-regulated in either polyA mRNA RNA or NRO RNA (Altered Gene Expression) if it was significantly different from the baseline at any point during the time course of activation; all other genes are in the 'Unaltered Gene Expression' category. The number and per cent of genes in each of 8 possible regulatory categories are displayed.
Figure 3
Figure 3
Comparison between polyA mRNA and nuclear run-on RNA of immediate early gene activation in Jurkat T cells. A.1 Heatmap of relative gene expression intensities (Z scores). A.2 Graphical representation of the same data illustrating an immediately apparent up-regulation of gene expression in NRO but not polyA mRNA. B. Single end-point PCR validation of up-regulation in polyA mRNA by 1 hour of a subset of genes shown to be activated within 5 minutes by nuclear run-on RNA. C. Patterns of polyA mRNA and nuclear run-on RNA levels for NFKB1 and its inhibitor (NFKBIA).
Figure 4
Figure 4
Global comparison of gene expression changes in polyA mRNA and NRO RNA. A. At each time period indicated columns correspond to the values derived by subtracting the Z ratio of NRO RNA from the Z ratio of polyA mRNA for every gene. Equivalency between calculations varies around 0, data is aligned using a combined average index, and is displayed from left to right to represent the highest average positive Z ratio difference to the lowest average negative Z ratio difference. Columns in red correspond to genes exhibiting significant differences (Z ratio difference values greater or less than ± 1.5) in gene expression changes when comparing polyA mRNA and NRO RNA for each gene at each time point. B. Hierarchical clustering of all significant changes in gene expression in either NRO or polyA mRNA across the time course of activation. The median Z score data for each gene is individually normalized to its baseline value in for the sake of this comparison.
Figure 5
Figure 5
Frequency distribution of gene expression patterns generated from polyA mRNA or NRO RNA. The top 20 patterns for each method is shown. Significant changes in gene expression were assigned a 1, -1, or 0 for up, down, or no change, respectively. In addition, a value of -1, 0, or 1 (low, moderate, or high) was assigned to each gene according to its relative intensity at baseline (0 time). The absolute numbers of genes in each pattern are reported in the column labeled Top 20 and the percentage of those genes relative to all significantly regulated genes can be found in the column labeled % Sig. Totals are as indicated at the bottom of each column. Filled-in boxes denote patterns equally shared in the top 20 between both methods
Figure 6
Figure 6
Differential distribution of transcriptional and polyA mRNA up- (A) or down- (B) regulated gene expression patterns during Jurkat T cell activation. The number of genes consistently regulated (up or down at every time point) are correlated with their relative expression baselines (Z score: high>1, 1>medium>-1, low<-1).
Figure 7
Figure 7
Persistence of stability-regulated changes in gene expression in the presence of Actinomycin D. A. Effect of Actinomycin D on the (P+I)-induced changes in the expression patterns of gene deemed to be transcriptionally regulated. Z ratio comparisons are made to the baseline or unactivated state. B. Lack of an effect of Actinomycin D on the (P+I)-induced changes in the expression patterns of genes deemed to be stability regulated. The absolute differences (Z diff) between the activated and un-activated state for both polyA mRNA and NRO RNA for a subset of these genes is shown. C. Comparison of the Z ratios for all significantly regulated genes in the presence or absence of Actinomycin D showing no corresponding regulation in NRO RNA. Data is sorted by polyA mRNA (without ActD) values and a significance threshold of Z ratios > ± 1.5 was used for these calculations.
Figure 8
Figure 8
Regulation of apoptotic pathways during T cell activation involves changes in gene expression by both mRNA transcriptional and mRNA stability mechanisms. Genes colored in red and blue were up- or down-regulated in polyA mRNA only. Genes colored in yellow and purple were up- or down-regulated in NRO RNA. Pathway is from a Kegg map modified in Genmapp2.0 [27].
Figure 9
Figure 9
Enrichment of NFAT and NFκB transcription factor-binding sites in the promoter regions of genes upregulated after 60 min of treatment of human Jurkat T cells with PMA + Ionomycin. Color gradient from bright red to bright green is directly proportional to Z ratios and indicates the increase (red) or decrease (green) of gene expression relative to baseline at each of the indicated time points.

References

    1. Legen J, Kemp S, Krause K, Profanter B, Herrmann RG, Maier RM. Comparative analysis of plastid transcription profiles of entire plastid chromosomes from tobacco attributed to wild-type and PEP- deficient transcription machineries. Plant J. 2002;31:171–188. doi: 10.1046/j.1365-313X.2002.01349.x. - DOI - PubMed
    1. Schena M, Shalon D, Davis RW, Brown PO. Quantitative monitoring of gene expression patterns with a complementary DNA microarray. Science. 1995;270:467–470. - PubMed
    1. Eberwine J. Amplification of mRNA populations using aRNA generated from immobilized oligo(dT)-T7 primed cDNA. Biotechniques. 1996;20:584–591. - PubMed
    1. Meininghaus M, Chapman RD, Horndasch M, Eick D. Conditional expression of RNA polymerase II in mammalian cells. Deletion of the carboxyl-terminal domain of the large subunit affects early steps in transcription. J Biol Chem. 2000;275:24375–24382. doi: 10.1074/jbc.M001883200. - DOI - PubMed
    1. Schuhmacher M, Kohlhuber F, Holzel M, Kaiser C, Burtscher H, Jarsch M, Bornkamm GW, Laux G, Polack A, Weidle UH, Eick D. The transcriptional program of a human B cell line in response to Myc. Nucleic Acids Res. 2001;29:397–406. doi: 10.1093/nar/29.2.397. - DOI - PMC - PubMed

MeSH terms

LinkOut - more resources