Effects of prednisolone treatment on cytokine expression in patients with leprosy type 1 reactions
- PMID: 15908402
- PMCID: PMC1111887
- DOI: 10.1128/IAI.73.6.3725-3733.2005
Effects of prednisolone treatment on cytokine expression in patients with leprosy type 1 reactions
Abstract
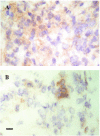
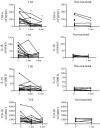
Leprosy type 1 reactions (T1R) are due to increased cell-mediated immunity and result in localized tissue damage. The anti-inflammatory drug prednisolone is used for treatment, but there is little good in vivo data on the molecular actions of prednisolone. We investigated the effect of prednisolone treatment on tumor necrosis factor alpha (TNF-alpha), interleukin-1beta (IL-1beta), IL-10, and transforming growth factor beta1 (TGF-beta1) mRNA and protein expression in blood and skin biopsies from 30 patients with T1R in India. After 1 month of prednisolone treatment the sizes of the skin granulomas were reduced, as were the grades of cells positive for TNF-alpha and IL-10 in skin lesions. Increased production of TGF-beta1 was seen in skin lesions after 6 months of prednisolone treatment. Expression of mRNA for TNF-alpha, IL-1beta, and TGF-beta1 was reduced, whereas no change in IL-10 mRNA expression was detected during treatment. The circulating cytokine profiles were similar in patients with and without T1R, and prednisolone treatment had no detectable effects on cytokine expression in the blood. The data emphasize the compartmentalization of pathology in T1R and the importance of the immune response in the skin. Clinical improvement and cytokine expression were compared. Surprisingly, patients with improved skin and nerve function and patients with nonimproved skin and nerve function had similar cytokine profiles, suggesting that clinical improvement is not directly mediated by the cytokines studied here. This in vivo well-controlled study of the immunosuppressive effects of prednisolone showed that the drug does not switch off cytokine responses effectively.
Figures


Similar articles
-
The Effects of Prednisolone Treatment on Cytokine Expression in Patients with Erythema Nodosum Leprosum Reactions.Front Immunol. 2018 Feb 9;9:189. doi: 10.3389/fimmu.2018.00189. eCollection 2018. Front Immunol. 2018. PMID: 29479352 Free PMC article.
-
Cortisol and proinflammatory cytokine profiles in type 1 (reversal) reactions of leprosy.Immunol Lett. 2013 Nov-Dec;156(1-2):159-67. doi: 10.1016/j.imlet.2013.10.008. Epub 2013 Nov 1. Immunol Lett. 2013. PMID: 24189521
-
Cytokine and protein markers of leprosy reactions in skin and nerves: baseline results for the North Indian INFIR cohort.PLoS Negl Trop Dis. 2011 Dec;5(12):e1327. doi: 10.1371/journal.pntd.0001327. Epub 2011 Dec 13. PLoS Negl Trop Dis. 2011. PMID: 22180790 Free PMC article.
-
In situ T regulatory cells and Th17 cytokines in paired samples of leprosy type 1 and type 2 reactions.PLoS One. 2018 Jun 8;13(6):e0196853. doi: 10.1371/journal.pone.0196853. eCollection 2018. PLoS One. 2018. PMID: 29883464 Free PMC article.
-
Longitudinal immune responses and gene expression profiles in type 1 leprosy reactions.J Clin Immunol. 2014 Feb;34(2):245-55. doi: 10.1007/s10875-013-9979-x. Epub 2013 Dec 27. J Clin Immunol. 2014. PMID: 24370984
Cited by
-
The Effects of Prednisolone Treatment on Cytokine Expression in Patients with Erythema Nodosum Leprosum Reactions.Front Immunol. 2018 Feb 9;9:189. doi: 10.3389/fimmu.2018.00189. eCollection 2018. Front Immunol. 2018. PMID: 29479352 Free PMC article.
-
Potential plasma markers of Type 1 and Type 2 leprosy reactions: a preliminary report.BMC Infect Dis. 2009 May 27;9:75. doi: 10.1186/1471-2334-9-75. BMC Infect Dis. 2009. PMID: 19473542 Free PMC article.
-
Serological responses to prednisolone treatment in leprosy reactions: study of TNF-α, antibodies to phenolic glycolipid-1, lipoarabinomanan, ceramide and S100-B.Lipids Health Dis. 2014 Jul 28;13:119. doi: 10.1186/1476-511X-13-119. Lipids Health Dis. 2014. PMID: 25070345 Free PMC article.
-
Prednisolone Alters Endometrial Decidual Cells and Affects Decidual-Trophoblast Interactions.Front Cell Dev Biol. 2021 Apr 9;9:647496. doi: 10.3389/fcell.2021.647496. eCollection 2021. Front Cell Dev Biol. 2021. PMID: 33898438 Free PMC article.
-
Serum Levels of Selected IL-1 Family Cytokines in Patients with Morphea.J Clin Med. 2022 Oct 28;11(21):6375. doi: 10.3390/jcm11216375. J Clin Med. 2022. PMID: 36362603 Free PMC article.
References
-
- Atkinson, S. E., S. Khanolkar-Young, S. Marlowe, S. Jain, R. G. Reddy, S. Suneetha, and D. N. J. Lockwood. 2004. Detection of IL-13, IL-10 and IL-6 in leprosy skin lesions of patients during prednisolone treatment for type 1 (T1R) reactions. Int. J. Lepr. Other Mycobact. Dis. 72:27-34. - PubMed
-
- Batuman, O. A., A. Ferrero, C. Cupp, S. A. Jimenez, and K. Khalili. 1995. Differential regulation of transforming growth factor beta-1 gene expression by glucocorticoids in human T and glial cells. J. Immunol. 155:4397-4405. - PubMed
Publication types
MeSH terms
Substances
LinkOut - more resources
Full Text Sources
Medical

