. 2005 Jun;8(6):813-9.
doi: 10.1038/nn1470. Epub 2005 May 22.

Instructive signals for motor learning from visual cortical area MT

Affiliations

Instructive signals for motor learning from visual cortical area MT

Megan R Carey et al. Nat Neurosci. 2005 Jun.

Erratum in

  • Nat Neurosci. 2005 Jul;8(7):969

Abstract

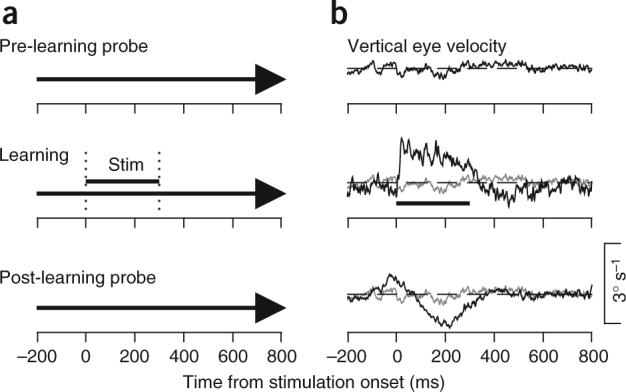
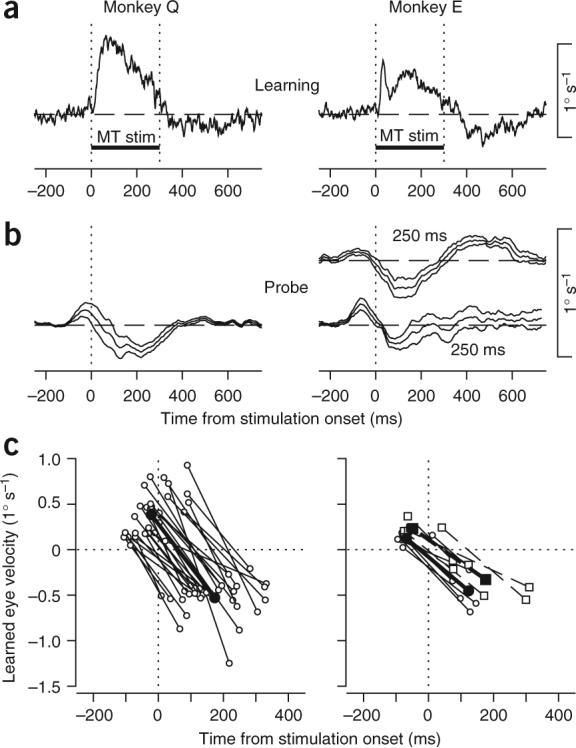
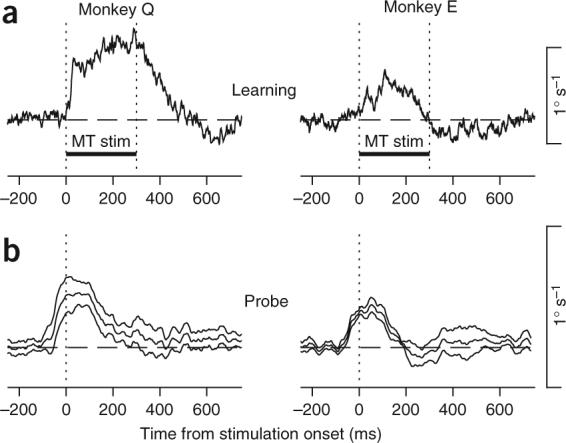
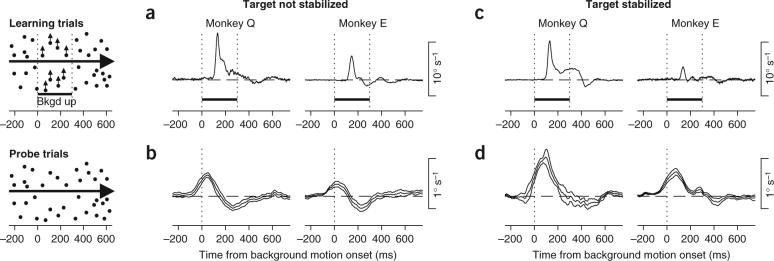
Sensory error signals have long been proposed to act as instructive signals to guide motor learning. Here we have exploited the temporal specificity of learning in smooth pursuit eye movements and the well-defined anatomical structure of the neural circuit for pursuit to identify a part of sensory cortex that provides instructive signals for motor learning in monkeys. We show that electrical microstimulation in the motion-sensitive middle temporal area (MT) of extrastriate visual cortex instructs learning in smooth eye movements in a way that closely mimics the learning instructed by real visual motion. We conclude that MT provides instructive signals for motor learning in smooth pursuit eye movements under natural conditions, suggesting a similar role for sensory cortices in many kinds of learned behaviors.


Figures

Figure 1
Figure 1
A sample experiment using MT microstimulation to instruct learning. (a) Schematic of the experimental design for a learning experiment. From top to bottom, the three schematics show the probe trials in the baseline block and the learning and probe trials in the learning block. The bold arrow indicates the rightward motion of the pursuit target as a function of time. The vertical dotted lines and the horizontal bar labeled ‘Stim’ indicate the interval when MT was stimulated in the learning trials. (b) Averaged eye velocity along the learning axis, which was vertical in this experiment. In each panel, the black trace shows vertical eye velocity as a function of time and the horizontal dashed line indicates zero eye velocity. In the second and third panels, the gray trace reiterates the vertical eye velocity in the pre-learning probe trials, also shown by the black trace in the top panel. For this and all figures, learning trial data are from early in the learning block, before learning has occurred, and learned eye movements on probe trials are after at least 100 learning trials. Upward deflection of the velocity traces corresponds to upward eye motion.
Figure 2
Figure 2
Summary of learned eye velocity when stimulation in MT provided the instructive signal for learning. (a) Time course of averaged eye velocity responses to MT stimulation in learning trials. The two vertical dotted lines and the horizontal bar labeled ‘MT stim’ indicate the interval of microstimulation. Data were taken from the first few learning trials before measurable learning had occurred. (b) Time course of learned eye movements (± s.e.m.) along the learning axis, measured in infrequent probe trials. Microstimulation started 200 ms after the onset of target motion in Monkey Q and either 200 or 250 ms after the onset of target motion for Monkey E. Data in a and b are averages across experimental days (n = 30 for Monkey Q, n = 6 for each temporal interval for Monkey E). (c) Summary of the two components of learned eye movements. Each point plots the positive or negative peak of learned eye velocity as a function of the time of the peak. Each pair of open symbols connected by a line shows data from an individual experiment. Filled symbols connected by bold lines show averages across all experiments. For Monkey E, circles and continuous lines show data obtained with an interval of 200 ms; squares and dashed lines show data obtained with an interval of 250 ms. Positive values of eye velocity indicate eye motion in the learning direction.
Figure 3
Figure 3
Summary of learned eye velocity when stimulation in MT combined with target stabilization provided the instructive signal for learning. (a) Time course of averaged eye velocity responses to MT stimulation in learning trials. The two vertical dotted lines and the horizontal bar labeled ‘MT stim’ indicate the interval of microstimulation and target stabilization. Data were taken from the first few learning trials before measurable learning had occurred. (b) Time course of learned eye movements (± s.e.m.) along the learning axis, measured in infrequent probe trials. Microstimulation started 200 ms after the onset of target motion in both monkeys. Data show averages across eight and five experimental days for Monkeys Q and E, respectively.
Figure 4
Figure 4
Learning instructed by motion of a visual background during orthogonal target motion. The diagrams on the left summarize the visual stimuli used to induce learning (top) and to evaluate the learned eye velocity (bottom). The interval indicated by the two vertical dotted lines and the horizontal bar labeled ‘Bkgd up’ indicates the time when the background stimulus moved upwards, starting 200 ms after target motion onset. (a,b) Learning instructed by background motion without target stabilization. (c,d) Learning instructed by background motion with target stabilization on the learning trials. (a,c) Averaged eye velocity responses during the first few learning trials, before measurable learning had occurred. Data are averages across experimental days (n = 7 for each monkey) and are plotted as a function of time from onset of visual background motion (time 0). (b,d) Learned eye movements on probe trials after at least 100 learning trials. Data are plotted as mean ± s.e.m. as a function of the time that visual background motion began on learning trials.
Figure 5
Figure 5
Temporal relationship between learning instructed by MT microstimulation and visual background motion. Each point plots the positive or negative peak of learned eye velocity as a function of the time of the peak. Each pair of open symbols connected by a line shows data from an individual visual background motion experiment. Filled circles connected by bold lines show averages across all background experiments. Filled squares and bold dashed lines show averages of the learning instructed by MT stimulation. Positive values of eye velocity indicate eye motion in the learning direction. Time zero indicates the onset of visual background motion or MT microstimulation in learning trials, which was 200 ms after target motion onset in both cases.
Figure 6
Figure 6
Comparison of learning instructed by MT stimulation and visual background motion at different times after the onset of pursuit target motion. (a) Average time courses of learned eye velocity: green, blue and red traces show results for experiments in which learning was induced by visual background motion that began 100, 150 or 200 ms after the onset of pursuit target motion, respectively. The colored arrows indicate the times of visual background motion in the learning trials for each experiment. (b) Each point plots the average positive or negative peak of the learned eye velocity as a function of the time of the peak. Each pair of symbols connected by a line shows data from an individual learning condition. Bold circles connected by dashed lines indicate the results of learning instructed by stimulation of MT. Smaller circles connected by thin lines indicate the results of learning instructed by background motion. For experiments with background motion, the colors have the same meaning as in a. For experiments with MT stimulation, the color scheme has been shifted by 50 ms: blue and red symbols indicate the MT stimulation occurred 200 or 250 ms after the onset of pursuit target motion in learning trials. In both a and b, time zero indicates the onset of pursuit target motion.

Similar articles

Cited by

References

    1. Schultz W, Dickinson A. Neuronal coding of prediction errors. Annu. Rev. Neurosci. 2000;23:473–500. - PubMed
    1. Rescorla RA, Wagner AR. A theory of pavlovian conditioning: variations in the effectiveness of reinforcement and nonreinforcement. In: Black AH, Prokasy WF, editors. Classical Conditioning II: Current Research and Theory. Appleton Century Crofts; New York: 1972. pp. 64–99.
    1. Ito M. Neural design of the cerebellar motor control system. Brain Res. 1972;40:81–84. - PubMed
    1. Rashbass C. The relationship between saccadic and smooth tracking eye movements. J. Physiol. (Lond.) 1961;159:326–338. - PMC - PubMed
    1. Robinson DA. The mechanics of human smooth pursuit eye movement. J. Physiol. (Lond.) 1965;180:569–591. - PMC - PubMed

Publication types