. 2005 May 23;33(9):2952-61.
doi: 10.1093/nar/gki582. Print 2005.

CpG Island microarray probe sequences derived from a physical library are representative of CpG Islands annotated on the human genome

Affiliations

CpG Island microarray probe sequences derived from a physical library are representative of CpG Islands annotated on the human genome

Lawrence E Heisler et al. Nucleic Acids Res. .

Abstract

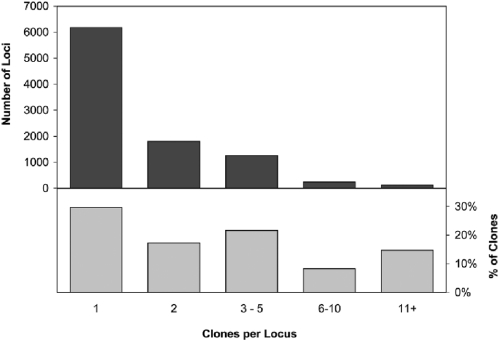
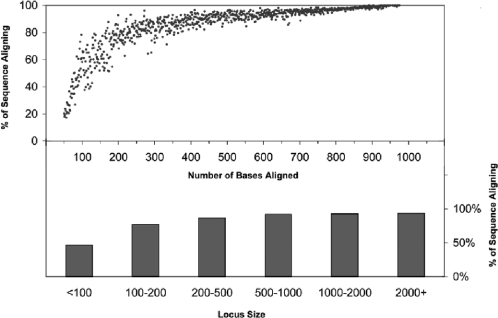
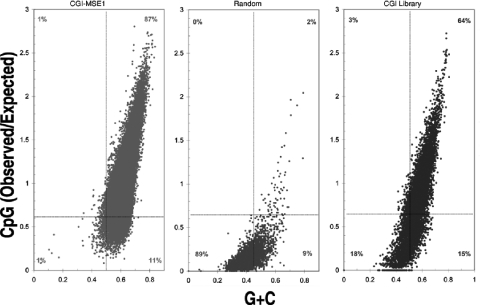
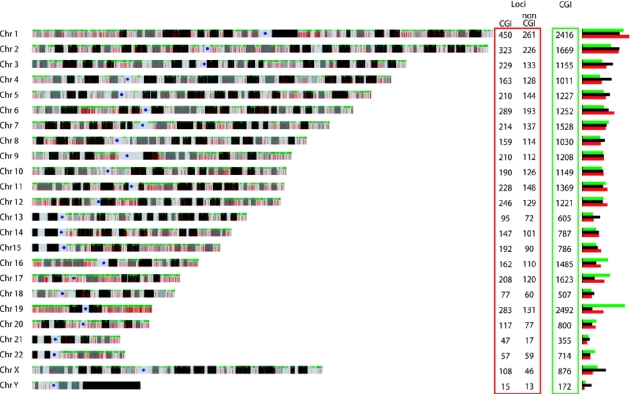
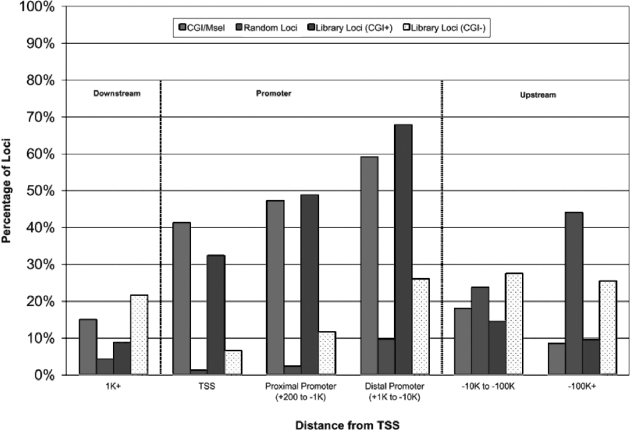
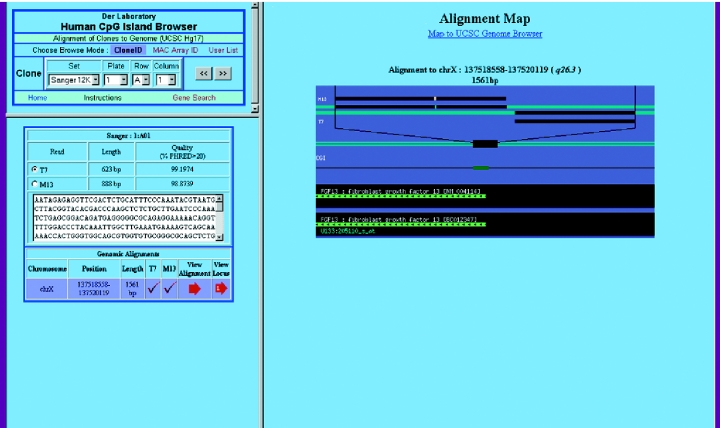
An effective tool for the global analysis of both DNA methylation status and protein-chromatin interactions is a microarray constructed with sequences containing regulatory elements. One type of array suited for this purpose takes advantage of the strong association between CpG Islands (CGIs) and gene regulatory regions. We have obtained 20,736 clones from a CGI Library and used these to construct CGI arrays. The utility of this library requires proper annotation and assessment of the clones, including CpG content, genomic origin and proximity to neighboring genes. Alignment of clone sequences to the human genome (UCSC hg17) identified 9595 distinct genomic loci; 64% were defined by a single clone while the remaining 36% were represented by multiple, redundant clones. Approximately 68% of the loci were located near a transcription start site. The distribution of these loci covered all 23 chromosomes, with 63% overlapping a bioinformatically identified CGI. The high representation of genomic CGI in this rich collection of clones supports the utilization of microarrays produced with this library for the study of global epigenetic mechanisms and protein-chromatin interactions. A browsable database is available on-line to facilitate exploration of the CGIs in this library and their association with annotated genes or promoter elements.


Figures

Figure 1
Figure 1
Clone composition of genomic loci. Each genomic locus is defined by one or more CGI library clone alignments. The majority of loci (6179/9552) are each defined by a single, non-redundant clone (upper panel, left-most bar). Fewer loci are represented by redundant clones with 1782 loci each defined by a pair of clones, 1240 by 3–5 clones, 235 by 6–10 clones and 118 loci each represented by 11 or more clones (range 11–582 clones). In the lower panel, the total number of clones represented in each group is indicated. The most redundant group consisting of 2958 clones defines only 118 loci.
Figure 2
Figure 2
Percentage of sequence aligning. In the upper panel, the percentage of the sequence length aligning is plotted against the total number of bases aligned (alignment length). The shorter alignments generally result from partial sequence alignments and as the total length of the alignment increases, so does the % aligning. The lower panel shows the % sequence alignment for loci of various size ranges. Loci <100 bp in length are generated mostly from these partial alignments, while the longer loci (200 bp) are derived from nearly complete sequence alignments.
Figure 3
Figure 3
Evaluation of GC and CpG dinucleotide content. CGI Library Loci (right panel) were evaluated for G + C content and CpG dinucleotide content (expressed as a ratio of the expected frequency of 1/16). For comparison, MseI fragments containing annotated CGIs (left panel) and random loci (center panel) were also evaluated. Dotted lines indicate the values frequently used for assessment of CGIs (G + C > 0.5, CpG observed/expected > 0.6). The percentage of Loci in each quadrant is indicated.
Figure 4
Figure 4
Distribution of CGIs across the human genome. A schematic diagram of the 23 human chromosomes is shown with Giemsa staining patterns in grayscale. Annotated CGIs are indicated in green (top of schematic diagram) and the number identified on each chromosome is indicated to the right (CGI). The position of each mapped locus is indicated in red (bottom of schematic diagram). The number identified on each chromosome is indicated to the right (Loci). The first column is the number of loci with a position that overlaps an Annotated CGI/MseI. The second column is the number of loci that do not overlap an annotated CGI/MseI. To the far right is indicated the proportional representation of the number of loci or annotated CGIs relative to chromosome length. Loci were also identified on mitochondrial DNA (14 loci) as well as on undesignated chromosome sequence collected into UCSC random sequence files (94 loci).
Figure 5
Figure 5
Position of Loci relative to gene TSSs. The distance to the nearest annotated TSS is shown for three sets of loci: the annotated CGI in the current build of the human genome (Hg17, May 2004); the random loci; and the loci derived from the CGI Library. The last set has been subdivided into loci which overlap an annotated CGI (solid) and those that do not (speckled). The percentage of loci in each set at various positions relative to the TSS is shown. (i) Promoter regions. Percentage of loci overlapping an annotated TSS, in the proximal promoter region (+200 to −1000 bp) and in the distal promoter region (+1000 to −10000 bp). (ii) Downstream (1000 bp or greater within a gene). (iii) Upstream between 10 and 100 kb upstream of a TSS or >100 kb upstream of a TSS.
Figure 6
Figure 6
12k CGI microarray. (A) A representative block from the CGI array after hybridization with 100 ng sonicated human genomic DNA. The faint spots in the lower left are the non-human DNA control probes. The corresponding spike-in controls were not added to the hybridization mixture. Arabidopsis controls were added to the hybridization and the Arabidopsis probes are in the lower right. (B) MA plot of differential expression (M) versus mean signal intensity (A) in log2-space for all CGI probes on the array. Only 32 of 12 196 probes display >2-fold differential expression (|M| > 1).
Figure 7
Figure 7
CGI library browser. An online CGI Library Browser () has been constructed to allow users of the CGI Promoter Microarrays as well as users interested in the CGI Library to explore alignments of the clones to the human genome. For each clone, alignments to the genome are listed and displayed diagrammatically, including the relative positions of annotated CGI and nearby genes.

References

    1. Oberley M.J., Tsao J., Yau P., Farnham P.J. High-throughput screening of chromatin immunoprecipitates using CpG-island microarrays. Methods Enzymol. 2004;376:315–334. - PubMed
    1. Kuras L. Characterization of protein–DNA association in vivo by chromatin immunoprecipitation. Methods Mol. Biol. 2004;284:147–162. - PubMed
    1. Im H., Grass J.A., Johnson K.D., Boyer M.E., Wu J., Bresnick E.H. Measurement of protein–DNA interactions in vivo by chromatin immunoprecipitation. Methods Mol. Biol. 2004;284:129–146. - PubMed
    1. Yan P.S., Wei S.H., Huang T.H. Differential methylation hybridization using CpG island arrays. Methods Mol. Biol. 2002;200:87–100. - PubMed
    1. Weinmann A.S., Yan P.S., Oberley M.J., Huang T.H., Farnham P.J. Isolating human transcription factor targets by coupling chromatin immunoprecipitation and CpG island microarray analysis. Genes Dev. 2002;16:235–244. - PMC - PubMed

Publication types