. 2005 May 31;102(22):7794-9.
doi: 10.1073/pnas.0407994102. Epub 2005 May 23.

The worldwide air transportation network: Anomalous centrality, community structure, and cities' global roles

Affiliations

The worldwide air transportation network: Anomalous centrality, community structure, and cities' global roles

R Guimerà et al. Proc Natl Acad Sci U S A. .

Abstract

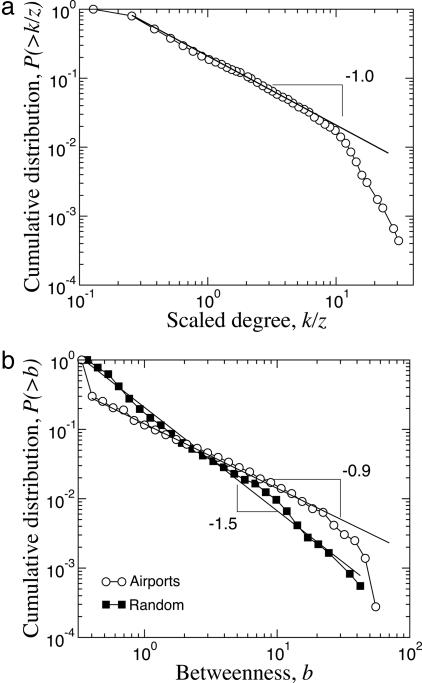
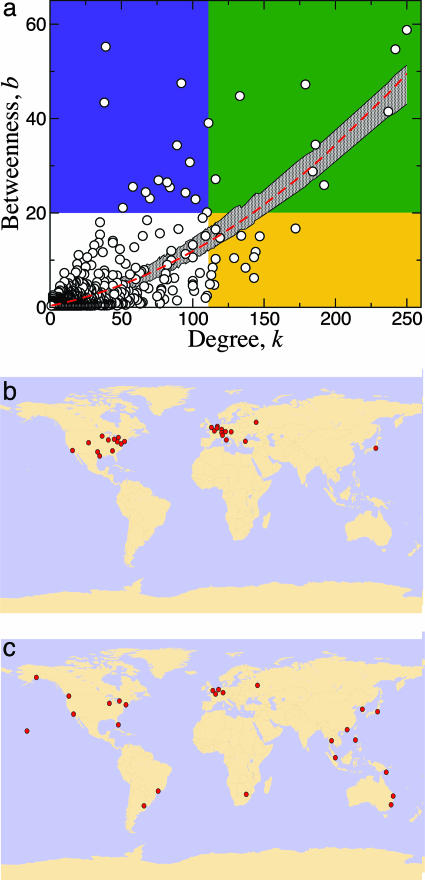
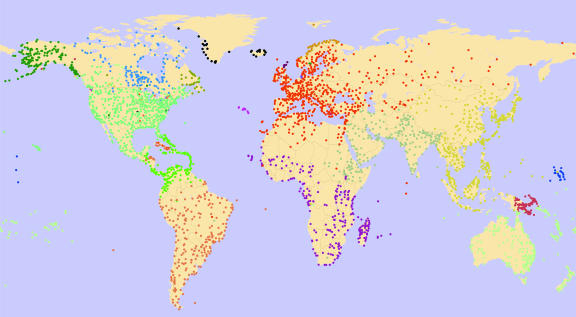
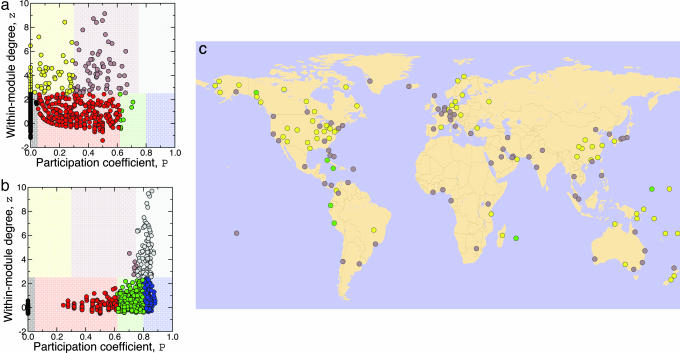
We analyze the global structure of the worldwide air transportation network, a critical infrastructure with an enormous impact on local, national, and international economies. We find that the worldwide air transportation network is a scale-free small-world network. In contrast to the prediction of scale-free network models, however, we find that the most connected cities are not necessarily the most central, resulting in anomalous values of the centrality. We demonstrate that these anomalies arise because of the multicommunity structure of the network. We identify the communities in the air transportation network and show that the community structure cannot be explained solely based on geographical constraints and that geopolitical considerations have to be taken into account. We identify each city's global role based on its pattern of intercommunity and intracommunity connections, which enables us to obtain scale-specific representations of the network.


Figures

Fig. 1.
Fig. 1.
Degree and betweenness distributions of the worldwide air transportation network. (a) Cumulative degree distribution plotted in double-logarithmic scale. The degree k is scaled by the average degree z of the network. The distribution displays a truncated power-law behavior with exponent α = 1.0 ± 0.1. (b) Cumulative distribution of normalized betweennesses plotted in double-logarithmic scale. The distribution displays a truncated power-law behavior with exponent ν = 0.9 ± 0.1. For a randomized network with exactly the same degree distribution as the original air transportation network, the betweenness distribution decays with an exponent ν = 1.5 ± 0.1. A comparison of the two cases clearly shows the existence of an excessive number of large betweenness values in the air transportation network.
Fig. 2.
Fig. 2.
Most-connected versus most-central cities in the worldwide air transportation network. (a) Betweenness as a function of the degree for the cities in the worldwide air transportation network (circles). For the randomized network, the betweenness is well described as a quadratic function of the degree (dashed line) with 95% of all data falling inside the gray region. In contrast to the strong correlation between degree and betweenness found for randomized networks, the air transportation network comprises many cities that are highly connected but have small betweenness and, conversely, many cities with small degree and large betweenness. We define a blue region containing the 25 most central cities in the world and a yellow region containing the 25 most connected cities. Surprisingly, we find there are only a few cities with large betweenness and degree (green region, which is the intersection of the blue and yellow regions). (b) The 25 most connected cities in the world. (c) The 25 most central cities in the world.
Fig. 3.
Fig. 3.
Communities in the giant component of the worldwide air transportation network. Each node represents a location, and each color corresponds to a community.
Fig. 4.
Fig. 4.
Toward a scale-specific representation of the worldwide air transportation network. (a) Each point in the zP phase-space corresponds to a city, and different colors indicate different roles. Most cities are classified as ultraperipheral (black) or peripheral (red) nodes. A small number of nonhub nodes play the role of connectors (green). We find approximately equal fractions of provincial (yellow) and connector (brown) hubs. (b) Same as a but for a randomization of the air transportation network. The absence of communities manifests itself in that most hubs become kinless hubs (gray) and in the appearance of kinless nonhubs (blue). (c) Nonhub connectors (green), provincial hubs (yellow), and connector hubs (brown) in the worldwide air transportation network.

References

    1. Bisseur, A. & Alamdari, F. (1998) Transportation 25, 331–355.
    1. Dana, L. P. & Vignali, D. (1999) Int. Marketing Rev. 16, 278–290.
    1. Turton, B. J. & Mutambirwa, C. C. (1996) Tourism Manage. 17, 453–462.
    1. Raguraman, K. (1998) Tourism Manage. 19, 533–543.
    1. Liljeros, F., Edling, C. R., Amaral, L. A. N., Stanley, H. E. & Aberg, Y. (2001) Nature 411, 907–908. - PubMed

LinkOut - more resources