

Macular segmentation with optical coherence tomography
- PMID: 15914617
- PMCID: PMC1939723
- DOI: 10.1167/iovs.04-0335
Macular segmentation with optical coherence tomography
Abstract
Purpose: To develop a software algorithm to perform automated segmentation of retinal layer structures on linear macular optical coherence tomography (StratusOCT; Carl Zeiss Meditec, Inc., Dublin, CA) scan images and to test its performance in discriminating normal from glaucomatous eyes in comparison with conventional circumpapillary nerve fiber layer (cpNFL) thickness measurement.
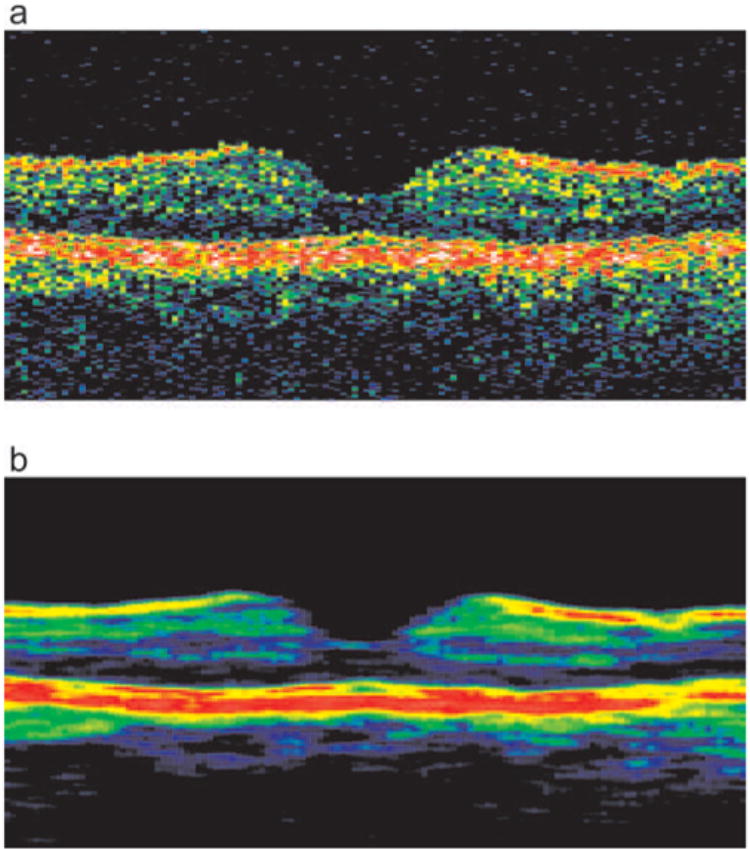
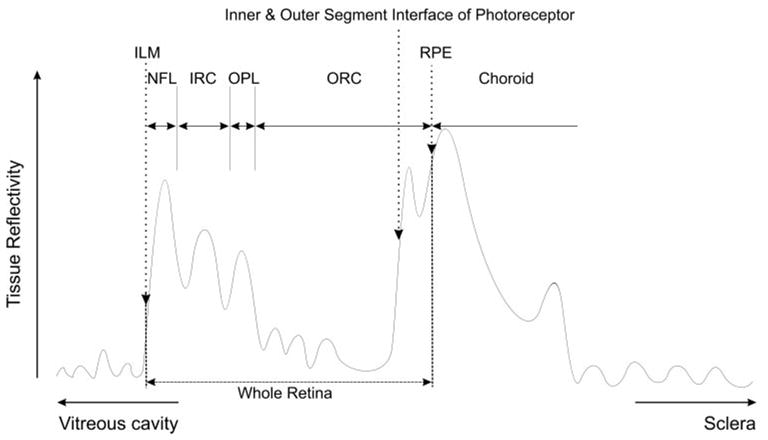
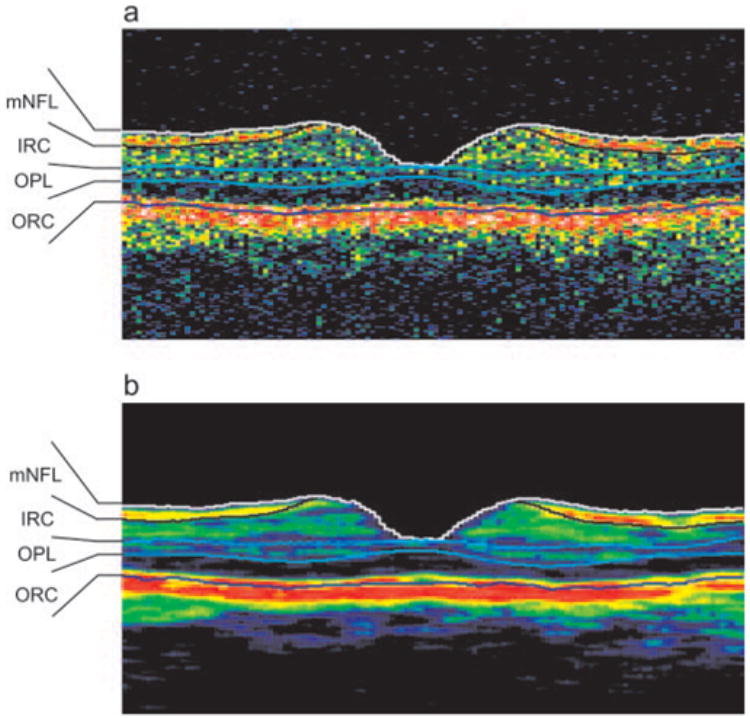
Methods: Four layer structures within the retina were defined: the macular nerve fiber layer (mNFL), the inner retinal complex (IRC; retinal ganglion cell [RGC] layer + inner plexiform and nuclear layers), outer plexiform layer (OPL), and outer retinal complex (ORC; outer nuclear layer + photoreceptor layer). Normal and glaucomatous eyes underwent fast macular map and fast NFL OCT scans. Linear macular images were analyzed using the developed algorithm, and the results were compared with the cpNFL thickness measurement.
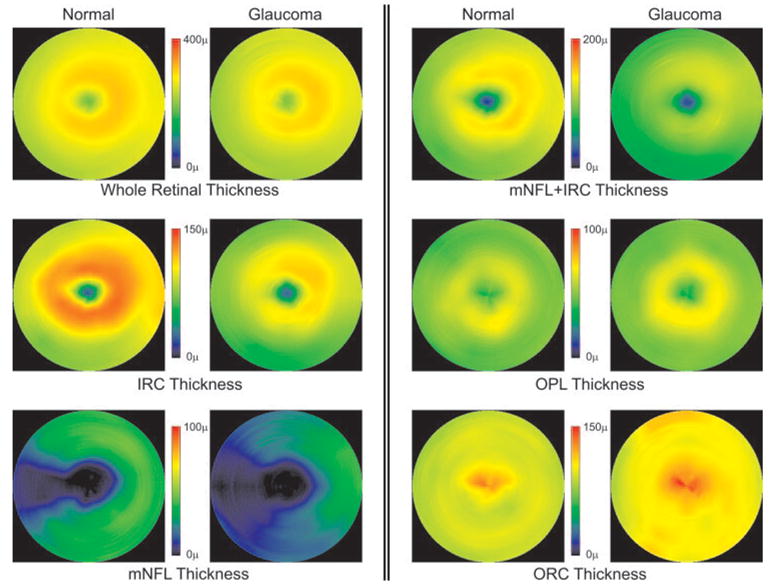
Results: Forty-seven subjects (23 normal and 24 with glaucoma) were analyzed. mNFL, cpNFL, IRC, and the total retinal thicknesses were significantly greater in normal than in glaucomatous eyes (P < or = 0.0002; Wilcoxon), whereas OPL thickness did not show a significant difference (P = 0.46). ORC thickness was significantly greater in glaucomatous than normal eyes (P = 0.035). Areas under the receiver operator characteristic curve (AROCs) for discriminating normal from glaucomatous eyes were highest with mNFL + IRC (0.97) and lowest with OPL (0.56). AROCs for OPL and ORC were significantly smaller than those for mNFL, IRC, mNFL+IRC, and cpNFL (P < or = 0.01). AROCs for IRC, mNFL + IRC, and cpNFL were significantly larger than for retinal thickness (P < or = 0.049). Among the best-performing parameters (mNFL, IRC, mNFL + IRC, and cpNFL) there was no significant difference in AROCs (P > or = 0.15).
Conclusions: The newly developed macular segmentation algorithm described herein demonstrated its ability to quantify objectively the glaucomatous damage to RGCs and NFL and to discriminate between glaucomatous and normal eyes. Further algorithm refinement and improvements in resolution and image quality may yield a more powerful methodology for clinical glaucoma evaluation.
Figures
References
-
- Zeimer R, Shahidi M, Mori M, et al. A new method for rapid mapping of the retinal thickness at the posterior pole. Invest Ophthalmol Vis Sci. 1996;37:1994–2001. - PubMed
-
- Asrani S, Zeimer R, Goldberg MF, et al. Application of rapid scanning retinal thickness analysis in retinal diseases. Ophthalmology. 1997;104:1145–1151. - PubMed
-
- Zeimer R, Asrani S, Zou S, et al. Quantitative detection of glaucomatous damage at the posterior pole by retinal thickness mapping. A pilot study. Ophthalmology. 1998;105:224–231. - PubMed
-
- Wollstein G, Schuman JS, Price LL, et al. Optical coherence tomography (OCT) macular and peripapillary retinal nerve fiber layer measurements and automated visual fields. Am J Ophthalmol. 2004;138:218–225. - PubMed
-
- Giovannini A, Amato G, Mariotti C. The macular thickness and volume in glaucoma: an analysis in normal and glaucomatous eyes using OCT. Acta Ophthalmol Scand Suppl. 2002;236:34–36. - PubMed
Publication types
MeSH terms
Grants and funding
LinkOut - more resources
Full Text Sources
Other Literature Sources
Medical
