. 2005 Jul 22;280(29):27466-76.
doi: 10.1074/jbc.M503836200. Epub 2005 May 25.

The peroxisome proliferator-activated receptor-gamma regulates murine pyruvate carboxylase gene expression in vivo and in vitro

Affiliations

The peroxisome proliferator-activated receptor-gamma regulates murine pyruvate carboxylase gene expression in vivo and in vitro

Sarawut Jitrapakdee et al. J Biol Chem. .

Abstract

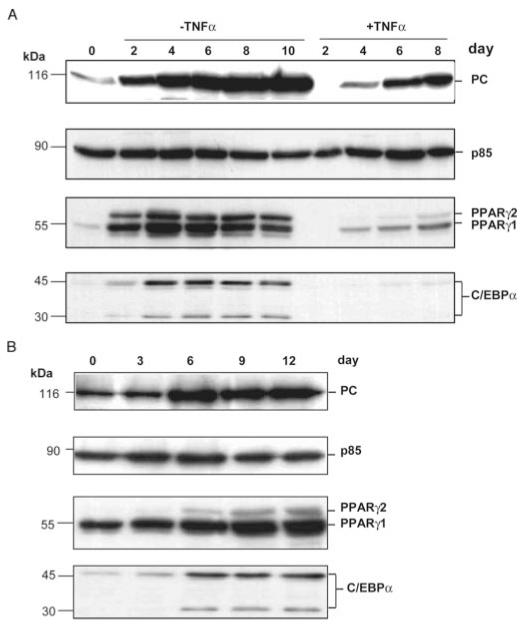
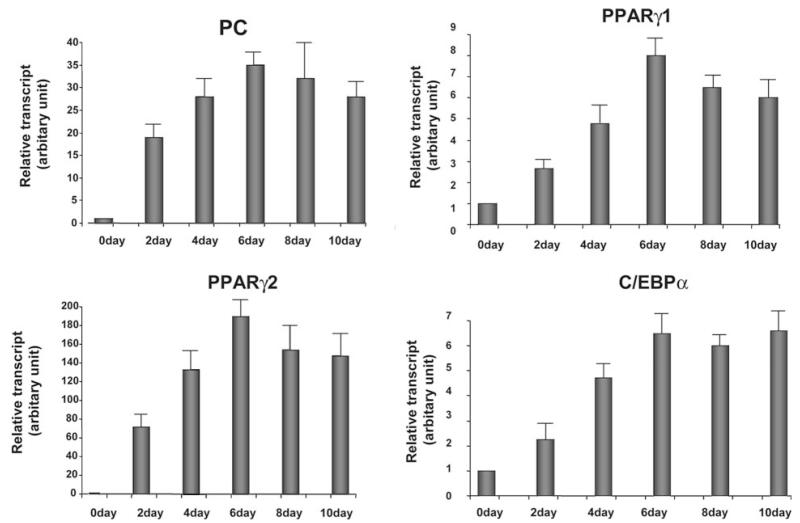
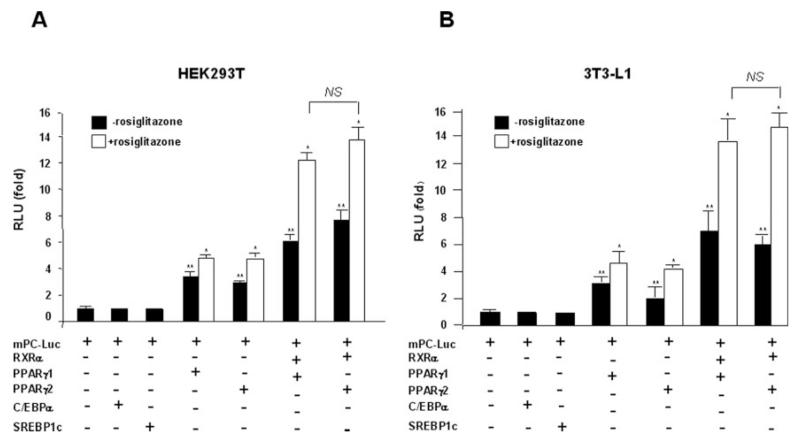
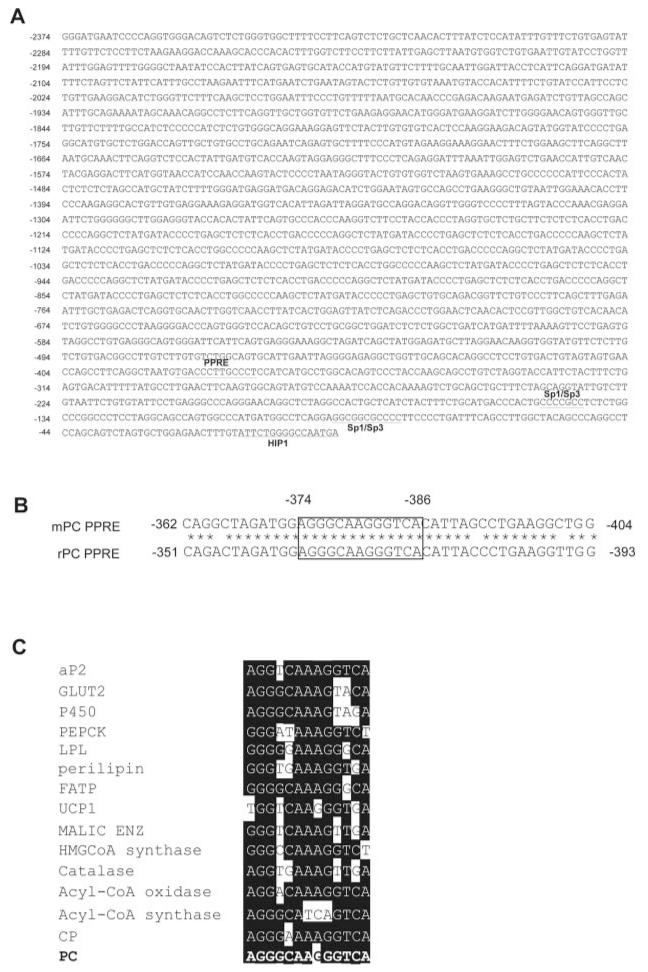
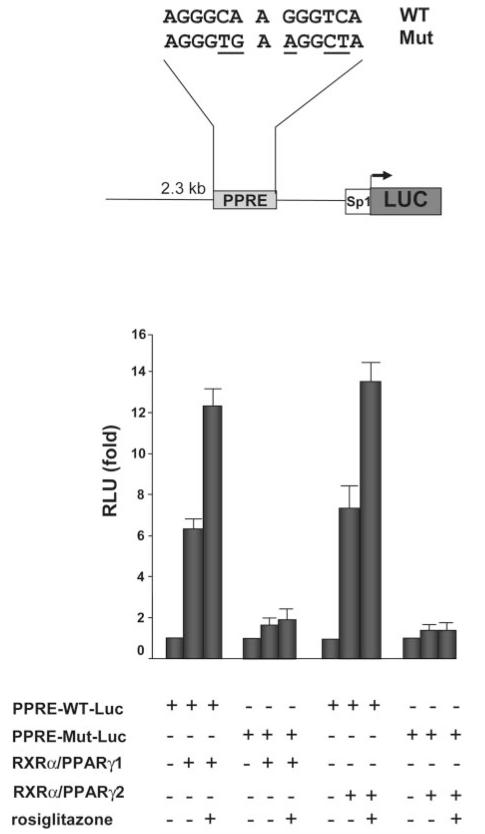
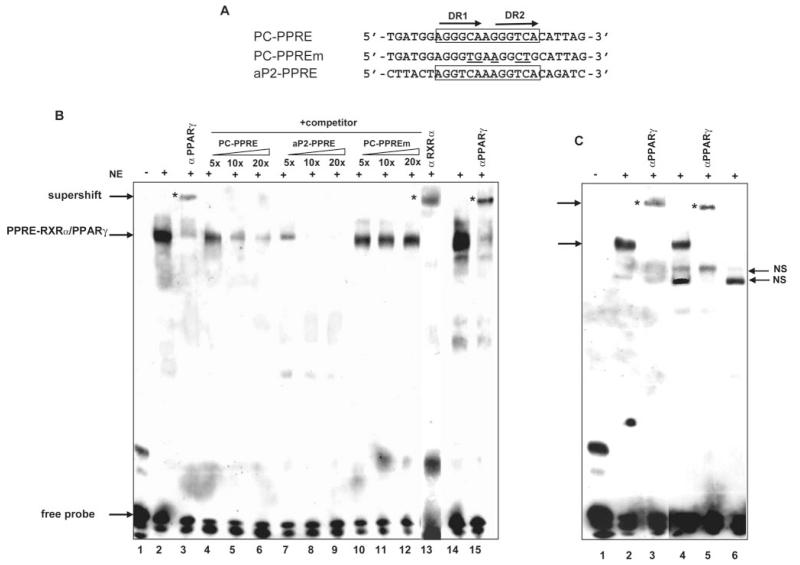
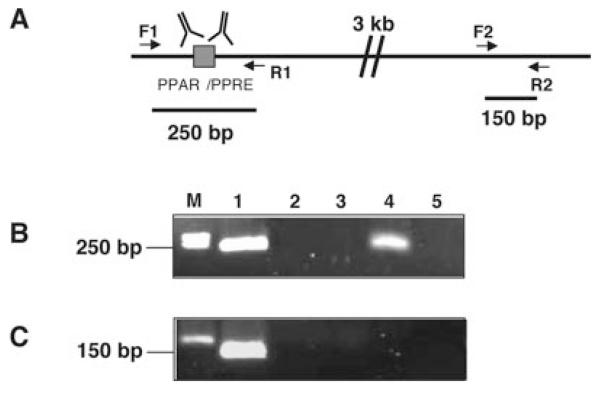
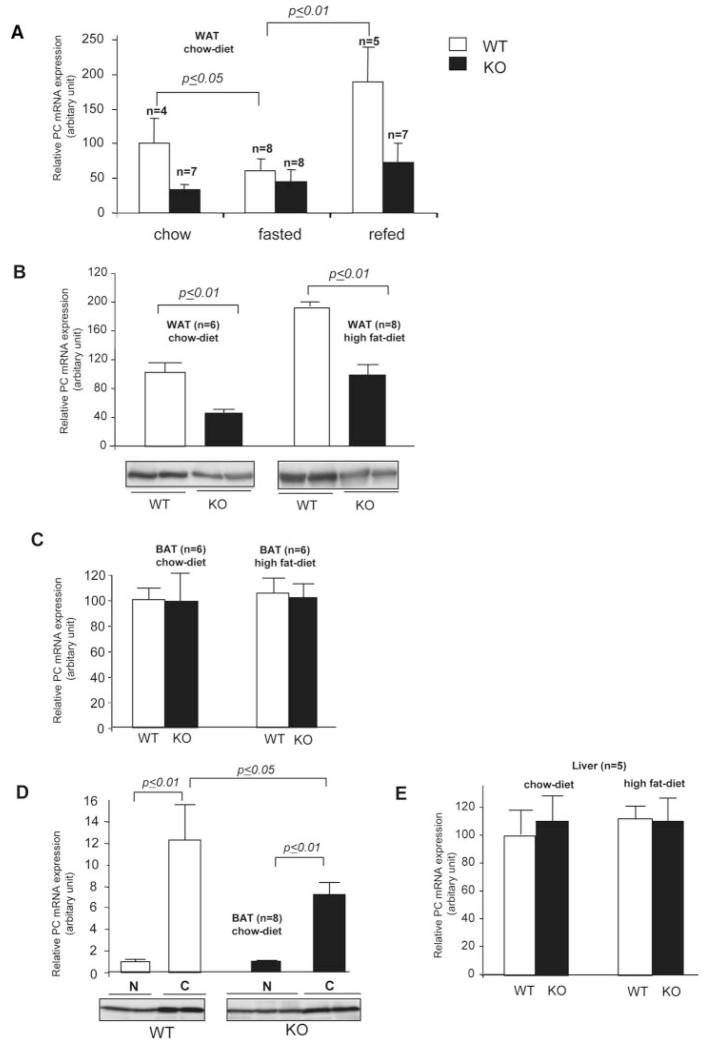
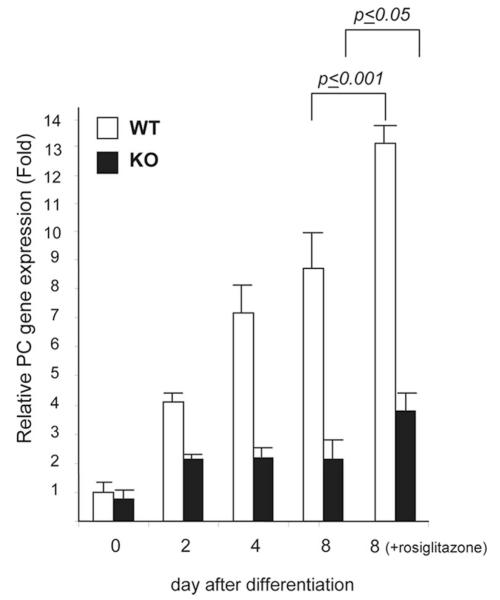
Pyruvate carboxylase (PC) plays a crucial role in various metabolic pathways, including gluconeogenesis, lipogenesis, and glucose-induced insulin secretion. Here we showed for the first time that the PC gene is transcriptionally regulated by peroxisome proliferator-activated receptor-gamma (PPARgamma) in vitro and in vivo in white and brown adipose tissue. PC mRNA and protein are markedly increased during differentiation of 3T3-L1 cells and HIB-1B, in parallel with the expression of the adipogenic transcription factors, CCAAT-enhancer binding protein alpha, PPARgamma1, and PPARgamma2. Tumor necrosis factor-alpha, a cytokine that blocks differentiation of 3T3-L1 cells, suppressed PC expression. Co-transfection studies in 3T3-L1 preadipocytes or HEK293T cells with a 2.3-kb promoter fragment of mouse PC gene linked to a luciferase reporter construct and with plasmids overexpressing retinoid X receptor alpha/PPARgamma1 or retinoid X receptor alpha/PPARgamma2 showed a 6-8-fold increase above the basal promoter activity. Furthermore, treatment of these transfected cells with the PPARgamma agonist doubled the promoter activity. Mutation of the putative PPAR-response element-(-386/-374) of this 2.3-kb PC promoter fragment abolished the PPARgamma response. Gel shift and chromatin immunoprecipitation assays demonstrated that endogenous PPARgamma binds to this functional PPAR-response element of the PC promoter. Mice with targeted disruption of the PPARgamma2 gene displayed approximately 50-60% reduction of PC mRNA and protein in white adipose tissue. Similarly, in brown adipose tissue of PPARgamma2-deficient mice subjected to cold exposure, PC mRNA was 40% lower than that of wild type mice. Impaired in vitro differentiation of white adipocytes of PPARgamma2 knock-out mice was also associated with a marked reduction of PC mRNA. Our findings identified PC as a PPARgamma-regulated gene and suggested a role for PPARgamma regulating intermediary metabolism.


Figures

FIG. 1
FIG. 1. Expression of PC protein with adipogenic transcription factors during differentiation of adipocytes
A, Western analysis of PC, PPARγ1, PPARγ2, and C/EBPα during differentiation of 3T3-L1 preadipocytes to mature adipocytes over 8 days in the absence or presence of TNFα. B, same analysis with brown adipocyte cell line, HIB-1B, differentiated for 12 days. Membranes were stripped and reprobed for anti-p85α subunit of phosphoinositol-3-phosphate kinase as a loading control.
FIG. 2
FIG. 2. Real time PCR analysis of expression of PC, PPARγ1, PPARγ2,and C/EBPα mRNAs in 3T3-L1 during differentiation at indicated times (day)
Total RNA was prepared, reverse-transcribed to cDNA, and analyzed by real time PCR with Taqman as described under “Experimental Procedures.” The abundance of each mRNA is normalized with 18 S and is shown as relative gene expression ± S.D. of three independent experiments. The relative gene expression detected at day 0 was arbitrarily set as 1.
FIG. 3
FIG. 3. Transactivation of the mPC promoter-luciferase reporter construct (PC-Luc) by PPARγ1 and PPARγ2 in 3T3-L1 and in HEK293T cells
The mPC promoter-luciferase reporter plasmid was transiently co-transfected with plasmids expressing C/EBPα, SREBP1c, or RXRα together with PPARγ1 or PPARγ2 into HEK293T (A) or 3T3-L1 (B). At 24 h post-transfection, cells were incubated with 0.1 μm rosiglitazone (open bar) or vehicle (solid bar) and further incubated for the next 24 h before being harvested and assayed for luciferase activity. The relative luciferase activities (RLU) shown are the means ± S.D. of three independent experiments, each in triplicate. Luciferase activity measured from the cells transfected with mPC-Luc alone (basal condition) in the absence of rosiglitazone was arbitrarily set as 1. ** represents p ≤ 0.001 compared with mPC-Luc; * represents p ≤ 0.05 compared with transfected cells treated with no rosiglitazone. NS, nonsignificance.
FIG. 4
FIG. 4. Identification of a putative PPRE in the mPC gene
A, nucleotide sequence of 2.3-kb DNA fragment upstream of the transcription start site of the lipogenic/gluconeogenic promoter of the mPC gene (22, 28). Putative transcription factor binding sites identified by TESS, including HIP1, PPRE, and Sp1/Sp3, are underlined. The transcription start site is designated as +1. B, comparison of the PPRE of the proximal promoters of the mouse (22) and rat PC gene (27). C, comparison of PPREs identified in various PPAR response genes. aP2, fatty acid-binding protein (24); GLUT2, glucose transporter 2 (29); P450, cytochrome P450 (30); PEPCK, phosphoenolpyruvate carboxykinase (31); catalase (32); malic enzyme (33); perilipin (34), HMG-CoA synthase (35); acyl-CoA oxidase (36); acyl-CoA synthase (37); LPL, lipoprotein lipase (38); FATP, fatty acid transporter (39); UCP1, uncoupling protein 1 (40); CP, muscle-type carnitine palmitoyltransferase (41).
FIG. 5
FIG. 5. Mutational analysis of putative PPRE-(−386/−374) in the mPC promoter
The wild type mPC promoter-luciferase (PPRE-WT-Luc) or its mutant (PPRE-Mut-Luc) construct alone or both were co-transfected with plasmids expressing either RXRα/PPARγ1 or RXRα/PPARγ2 into HEK293T cells. At 24 h post-transfection, cells were incubated with 0.1 μm rosiglitazone or vehicle and incubated for a further 24 h before being harvested and assayed for luciferase activity. The relative luciferase activities (RLU) shown are the means ± S.D. of three independent experiments, each in triplicate. Luciferase activity measured from the cells transfected with mPC-Luc alone (basal condition) in the absence of rosiglitazone was arbitrarily set as 1.
FIG. 6
FIG. 6. Electrophoretic mobility shift and supershift assays of putative PPRE (region −386 to −374) of the mPC promoter
A, the wild type PPRE and mutant PPRE of the mPC (underlines indicate the mutated nucleotides) as well as the PPRE of aP2. B, the 3′-biotin-labeled double-stranded oligonucleotide probe corresponding to −386 to −374 of PPRE of the mouse PC promoter (PC-PPRE) was incubated with 10 μg of nuclear extract (NE) of 6-day differentiated 3T3-L1 cells, in the absence or presence of PPARγ antibody. The gel was transferred to a nylon membrane, and the shifted bands were detected by incubating the membrane with streptavidin-horseradish peroxidase followed by chemiluminescence detection. Lane 1, PC-PPRE probe alone; lane 2, probe with nuclear extract. Anti-PPARγ (lane 3) or anti-RXRα (lane 13) was included in the supershifted assay. The PC-PPRE, PPRE of aP2 (aP2-PPRE), and the mutant PC-PPRE (PC-PPREm) unlabeled, double-stranded oligonucleotides were included as the competitor with nuclear extract in the assays (lanes 4–12, respectively). The biotin-labeled double-stranded aP2-PPRE probe was also incubated with 3T3-L1 nuclear extract in the absence (lane 14) or presence of PPARγ antibody (lane 15). The long triangles refer to the use of increasing amounts of the unlabeled competitor (PC-PPRE, aP2-PPRE, and PC-PPREm (5:1, 10:1, and 20:1 excess, respectively)). Arrows represent the PPRE·RXRα·PPARγ complex, whereas asterisks indicate supershift bands. C, EMSA of PPRE of the mPC with nuclear extract prepared from HEK293T overexpressing RXRα/PPARγ. Lane 1, probe alone; lane 2, probe with nuclear extract of HEK293T overexpressing PPARγ1. Lane 3, same as lane 2 but with PPARγ antibody. Lane 4, probe with nuclear extract of HEK293T overexpressing PPARγ2. Lane 5, same as lane 4 but with PPARγ antibody. Lane 6, probe with nuclear extract of mock-transfected HEK293T. NS, nonspecific binding. +/-, with or without nuclear extract (NE).
FIG. 7
FIG. 7. Chromatin immunoprecipitation assay of PPARγ bound to PPRE of mPC promoter in 3T3-L1 adipocytes
Soluble chromatin was prepared from 6-day differentiated 3T3-L1 described under “Experimental Procedures.” The PPARγ-associated DNA fragments were immunoprecipitated (IP) with mouse monoclonal antibodies against E2F or PPARγ. A, the positions of primers (arrows) relative to the PPRE of the mPC promoter (shaded box) are shown. B, the PPARγ-associated PPRE of the mPC promoter was PCR-amplified with F1 and R1 primers before immunoprecipitation (“input”, lane 1) and after immunoprecipitation with anti-E2F (lane 2) or with 10 (lane 3) or 50 μl (lane 4) of anti-PPARγ. Lane 5, negative control DNA template. Lane M, DNA marker. C, PCR was performed with negative control primers (F2 and R2) that are located >3 kb downstream of the PPRE.
FIG. 8
FIG. 8. Down-regulation of PC mRNA and protein in white adipose tissue and brown adipose tissue of PPARγ2 knock-out mice
A, white adipose tissues (WAT) were collected from wild type (WT) or PPARγ2 knock-out (KO) mice fed, fasted, or refed with chow diet. B, white adipose tissues collected from wild type or knock-out mice fed with a high fat diet were compared with those fed with a chow diet. Western analysis of each group of animals is shown below the graph. C, brown adipose tissues (BAT) were collected from wild type and knockout mice fed with chow or high fat diet. D, BAT were collected from wild type and knock-out mice fed with chow diet and maintained at room temperature (25 °C) or cold temperature (4 °C). Western analysis of each group of animals is shown below the graph. E, livers were collected from wild type or knock-out fed with chow or high fat diet. Total RNAs were extracted, reverse-transcribed to cDNA, and analyzed by real time PCR with PC primer and Taqman probe. The abundance of PC mRNA is normalized with 18 S and is shown as relative gene expression ± S.D. The relative PC mRNA expression detected in tissues from wild type mice for each treatment was arbitrarily set as 100%. Total cell lysates were also prepared from these tissues, and 50 μg of total protein was subjected to Western blot analysis with PC antibody. N, room temperature; C, cold exposure. n = number of mice in each experiment.
FIG. 9
FIG. 9. Impaired PC mRNA expression in primary cultures of white adipose tissue of wild type and knock-out mice
Preadipocytes isolated from epididymal fat of wild type (WT, open bars) and PPARγ2 knock-out (KO, filled bars) mice were differentiated in vitro in the presence or absence of 0.1 μm rosiglitazone. Total RNAs obtained at the time points indicated were analyzed by real time PCR as described under “Experimental Procedures.” The abundance of PC mRNA was normalized with 18 S. Results shown are mean of independent experiments. The relative gene expression detected at day 0 of wild type mice was arbitrarily set as 1.

References

    1. Mackall JC, Student AK, Polakis SE, Lane MD. J. Biol. Chem. 1976;251:6462–6464. - PubMed
    1. Cowherd RM, Lyle RE, McGehee RE., Jr. Semin. Cell. Dev. Biol. 1999;10:3–10. - PubMed
    1. Rosen ED, Walkey CJ, Puigserver P, Spiegelman BM. Genes Dev. 2000;14:1293–1307. - PubMed
    1. Rosen ED, Spiegelman BM. Annu. Rev. Cell Dev. Biol. 2000;16:145–171. - PubMed
    1. Rosen ED, Spiegelman BM. J. Biol. Chem. 2001;276:37731–37734. - PubMed

Publication types

LinkOut - more resources