. 2005 Jul 22;280(29):26796-804.
doi: 10.1074/jbc.M503805200. Epub 2005 May 24.

Epidermal growth factor receptors are localized to lipid rafts that contain a balance of inner and outer leaflet lipids: a shotgun lipidomics study

Affiliations

Epidermal growth factor receptors are localized to lipid rafts that contain a balance of inner and outer leaflet lipids: a shotgun lipidomics study

Linda J Pike et al. J Biol Chem. .

Abstract

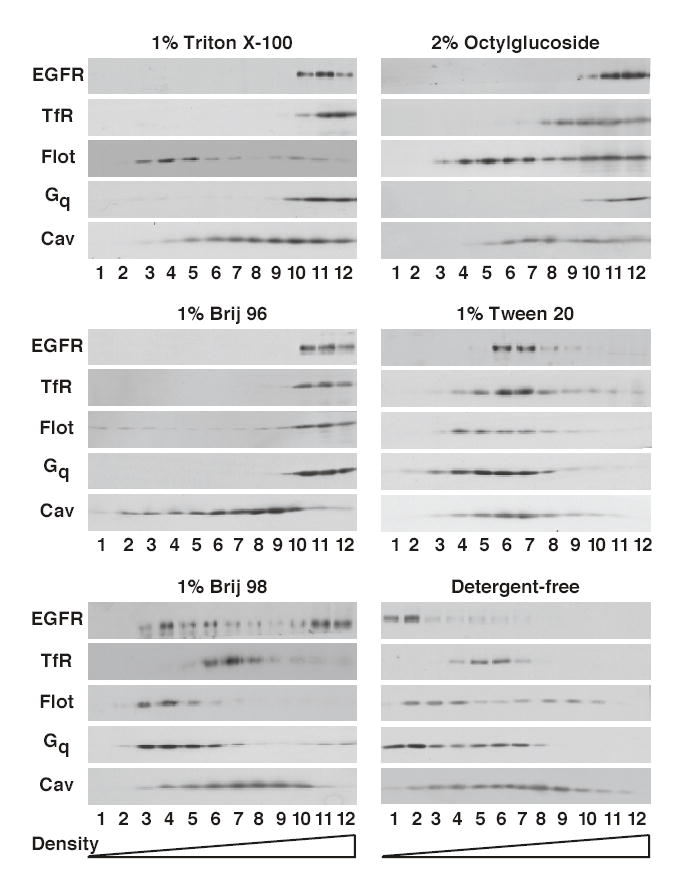
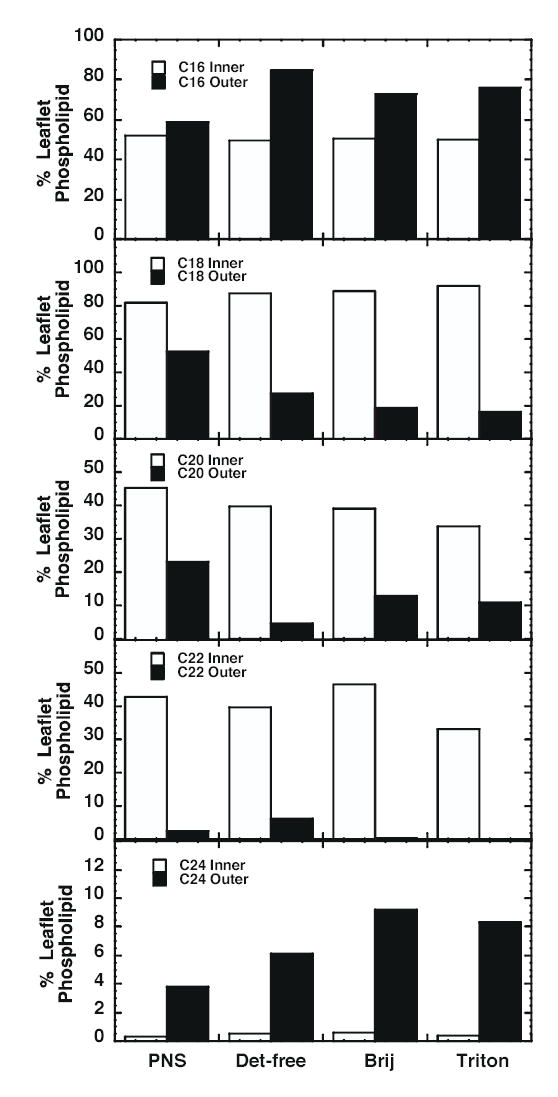
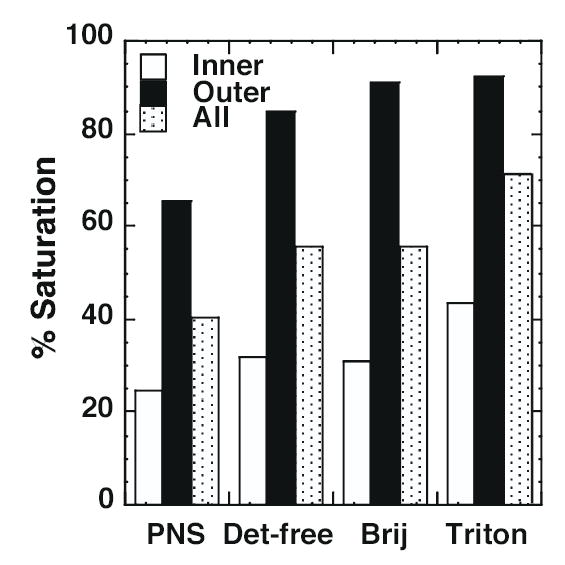
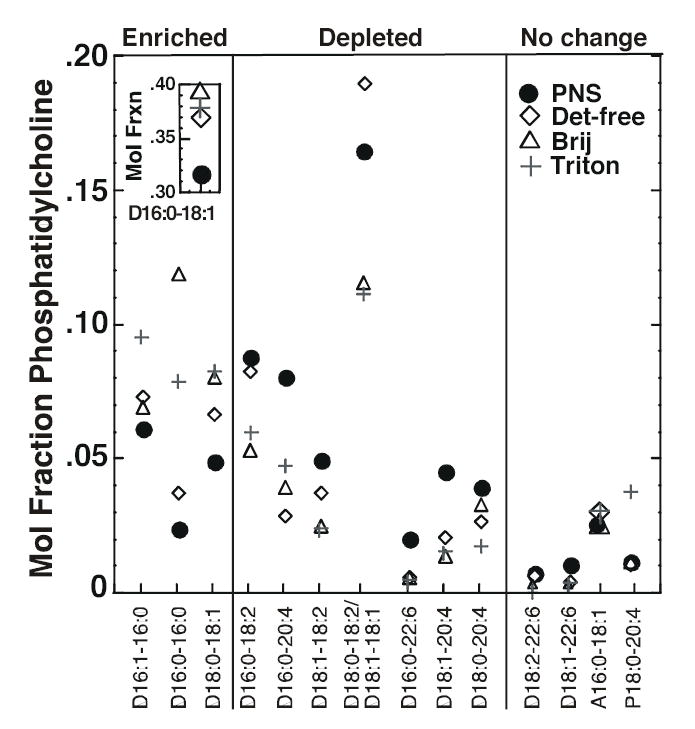
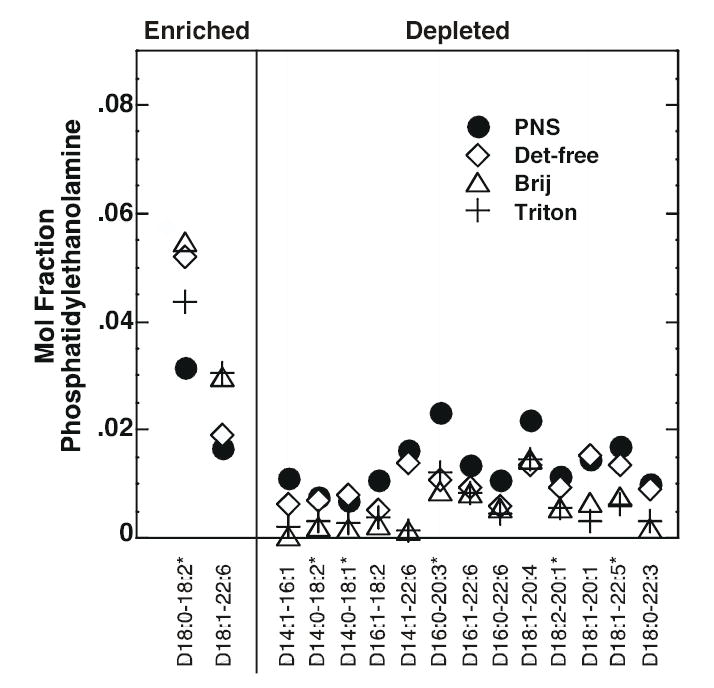
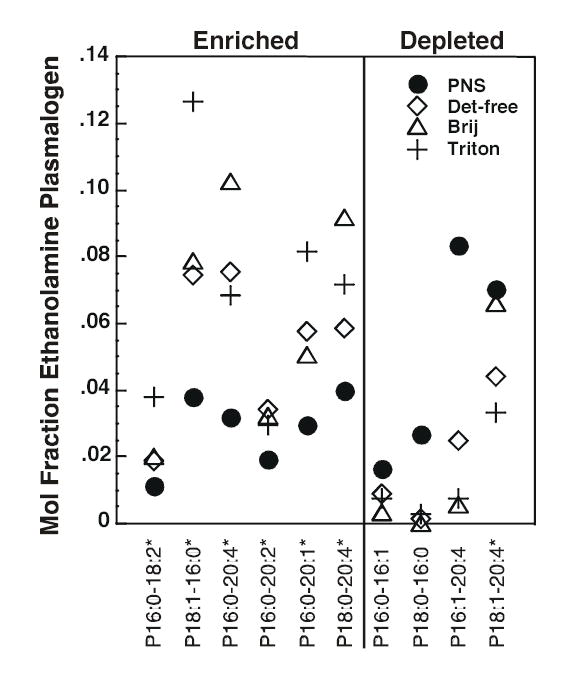
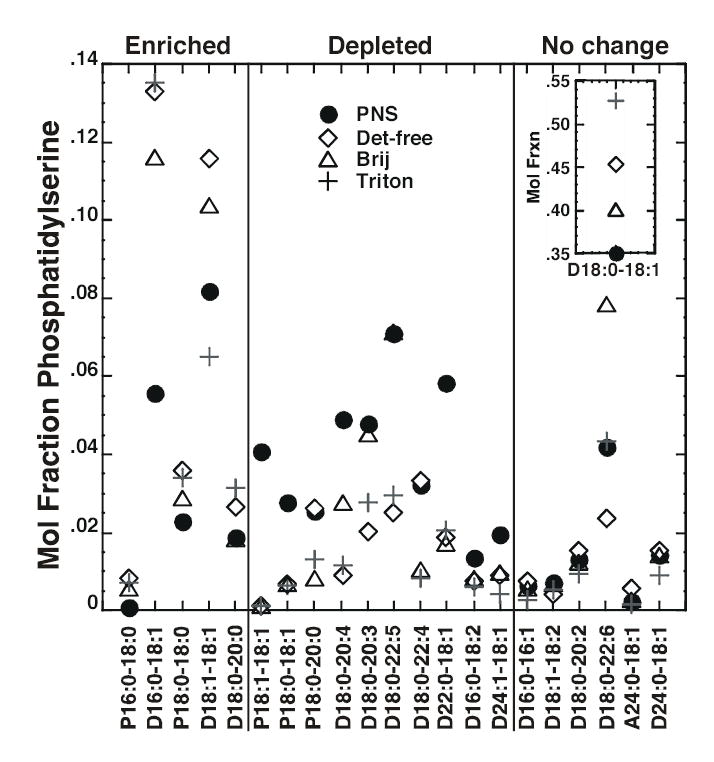
The epidermal growth factor (EGF) receptor partitions into lipid rafts made using a detergent-free method, but is extracted from low density fractions by Triton X-100. By screening several detergents, we identified Brij 98 as a detergent in which the EGF receptor is retained in detergent-resistant membrane fractions. To identify the difference in lipid composition between those rafts that harbored the EGF receptor (detergent-free and Brij 98-resistant) and those that did not (Triton X-100-resistant), we used multidimensional electrospray ionization mass spectrometry to perform a lipidomics study on these three raft preparations. Although all three raft preparations were similarly enriched in cholesterol, the EGF receptor-containing rafts contained more ethanolamine glycerophospholipids and less sphingomyelin than did the non-EGF receptor-containing Triton X-100 rafts. As a result, the detergent-free and Brij 98-resistant rafts exhibited a balance of inner and outer leaflet lipids, whereas the Triton X-100 rafts contained a preponderance of outer leaflet lipids. Furthermore, in all raft preparations, the outer leaflet phospholipid species were significantly different from those in the bulk membrane, whereas the inner leaflet lipids were quite similar to those found in the bulk membrane. These findings indicate that the EGF receptor is retained only in rafts that exhibit a lipid distribution compatible with a bilayer structure and that the selection of phospholipids for inclusion into rafts occurs mainly on the outer leaflet lipids.


Figures

Figure 1
Figure 1. Density gradient analysis of lipid rafts prepared using different detergents
Detergentresistant membranes or detergent-free lipid rafts were prepared from CHO cells as described in Materials and Methods. Extracts were separated by density gradient centrifugation and the gradients fractionated into 12 fractions. An equal volume of each fraction was analyzed by SDS polyacrylamide gel electrophoresis followed by Western blotting with the indicated antibody.
Figure 2
Figure 2. Characterization of detergent-resistant membranes prepared using 1% Brij 98
CHO cells were solubilized with 1% Brij 98 and the extracts analyzed by sucrose density gradient centrifugation as described in Materials and Method. Gradients were fractionated and equal volumes of each fraction were separated by SDS polyacrylamide gel electrophoresis. Gels were transferred to Immobilon and subjected to Western blotting using the indicated antibody. Left gradient, sucrose solutions contained no Brij 98. Right gradient, sucrose solutions contained 0.5% Brij 98.
Figure 3
Figure 3
Comparison of fatty acyl chain length in inner and outer leaflet lipids. Inner leaflet lipids were defined as PE, PS, PtdIno, PtdH and PtdGro. Outer leaflet lipids included PC and SPM. The values were calculated as the nmol/mg protein of all species of inner or outer leaflet phospholipid containing at least one chain of a given length divided by the total nmol/mg protein of inner or outer leaflet lipids. The value was multiplied by 100 to obtain a percent of total. Because each phospholipid species contains 2 fatty acyl groups, the inner leaflet lipids total ~200%. SPM has only one fatty acid group (in addition to the C18 backbone of sphingosine) and thus the outer leaflet lipids show variable totals depending on the mol% of SPM in the membrane.
Figure 4
Figure 4. Fractional saturation of fatty acyl chains in inner and outer leaflet lipids
A saturated phospholipid was defined as one in which there was ≤ 1 double bond between the two fatty acyl chains in the lipid. The total nmol/mg protein of saturated species was divided by the total nmol/mg protein of that class of phospholipid and multiplied by 100 to obtain the % saturation. Results are from the averaged data sets for each class of phospholipids.
Figure 5
Figure 5. Mole fraction of PC species in PNS and lipid raft preparations
The mole fraction (relative abundance) of each species was calculated by dividing the actual abundance of that species by the total amount of PC present in that particular membrane preparation. Each symbol represents the mole fraction of the species indicated on the X-axis in the indicated membrane preparation. The first number in each pair on the X-axis refers to the number of carbon atoms in the fatty acyl chain. The number after the colon refers to the number of double bonds. The two fatty acyl chain designations are separated by a hyphen. The prefix P indicates a plasmenyl compound. The prefix A indicates a plasmanyl compound. All other species are diacyl compounds. A species was designated as “enriched” if at least two of the three raft preparations showed a greater mole fraction of that species as compared to the PNS. Data represent the average of three experiments. The absolute abundance data are given in Supplemental Table 1.
Figure 6
Figure 6. Mole fraction of phosphatidylethanolamine species in PNS and lipid raft preparations
The mole fraction (relative abundance) of each species was calculated by dividing the actual abundance of that species by the total amount of PE present in that particular membrane preparation. Each symbol represents the mole fraction of the species indicated on the X-axis in the indicated membrane preparation. The first number in each pair on the X-axis refers to the number of carbon atoms in the fatty acyl chain. The number after the colon refers to the number of double bonds. The two fatty acyl chain designations are separated by a hyphen. All species are diacyl compounds. Species marked with an asterisk are those for which there are other isobaric species. A species was designated as “enriched” if at least two of the three raft preparations showed a greater relative abundance of that species as compared to the PNS. Data represent the average of three experiments. The absolute abundance data are given in Supplemental Table 2.
Figure 7
Figure 7. Mole fraction of ethanolamine plasmalogens in PNS and lipid raft preparations
The mole fraction (relative abundance) of each species was calculated by dividing the actual abundance of that species by the total amount of PE present in that particular membrane preparation. Each symbol represents the fractional abundance of the species indicated on the X-axis in the indicated membrane preparation. The first number in each pair on the X-axis refers to the number of carbon atoms in the fatty acyl chain. The number after the colon refers to the number of double bonds. The two fatty acyl chain designations are separated by a hyphen. The prefix P indicates a plasmenyl compound. Species marked with an asterisk are those for which there are other isobaric species. A species was designated as “enriched” if at least two of the three raft preparations showed a greater relative abundance of that species as compared to the PNS. Data represent the average of three experiments. The absolute abundance data are given in Supplemental Table II.
Figure 8
Figure 8. Mole fraction of PS species in PNS and lipid raft preparations
The mole fraction (relative abundance) of each species was calculated by dividing the actual abundance of that species by the total amount of PS present in that particular membrane preparation. Each symbol represents the fractional abundance of the species indicated on the X-axis in the indicated membrane preparation. The first number in each pair on the X-axis refers to the number of carbon atoms in the fatty acyl chain. The number after the colon refers to the number of double bonds. The two fatty acyl chain designations are separated by a hyphen. The prefix P indicates a plasmenyl compound. The prefix A indicates a plasmanyl compound. All other species are diacyl compounds. A species was designated as “enriched” if at least two of the three raft preparations showed a greater relative abundance of that species as compared to the PNS. Data represent the average of three experiments. The absolute abundance data are given in Supplemental Table 3.

References

    1. Brown DA, Rose JK. Cell. 1992;68:533–544. - PubMed
    1. Fiedler K, Kobayashi T, Kurzchalia TV, Simons K. Biochem. 1993:6365–6373. - PubMed
    1. Prinetti A, Chigorno V, Tettamanti G, Sonnino S. J Biol Chem. 2000;275:11658–11665. - PubMed
    1. Brown DA, London E. J Biol Chem. 2000;275:17221–17224. - PubMed
    1. Edidin M. Ann Rev Biophy Biomol Struct. 2003;32:257–283. - PubMed

Publication types