Comparative Study
. 2005 May 25;25(21):5259-71.
doi: 10.1523/JNEUROSCI.0827-05.2005.

Developmental changes in AMPA and kainate receptor-mediated quantal transmission at thalamocortical synapses in the barrel cortex

Affiliations
Comparative Study

Developmental changes in AMPA and kainate receptor-mediated quantal transmission at thalamocortical synapses in the barrel cortex

Neil J Bannister et al. J Neurosci. .

Erratum in

  • J Neurosci. 2005 Jun 8;25(23):5666

Abstract

During the first week of life, there is a shift from kainate to AMPA receptor-mediated thalamocortical transmission in layer IV barrel cortex. However, the mechanisms underlying this change and the differential properties of AMPA and kainate receptor-mediated transmission remain essentially unexplored. To investigate this, we studied the quantal properties of AMPA and kainate receptor-mediated transmission using strontium-evoked miniature EPSCs. AMPA and kainate receptor-mediated transmission exhibited very different quantal properties but were never coactivated by a single quantum of transmitter, indicating complete segregation to different synapses within the thalamocortical input. Nonstationary fluctuation analysis showed that synaptic AMPA receptors exhibited a range of single-channel conductance (gamma) and a strong negative correlation between gamma and functional channel number, indicating that these two parameters are reciprocally regulated at thalamocortical synapses. We obtained the first estimate of gamma for synaptic kainate receptors (<2 pS), and this primarily accounted for the small quantal size of kainate receptor-mediated transmission. Developmentally, the quantal contribution to transmission of AMPA receptors increased and that of kainate receptors decreased. No changes in AMPA or kainate quantal amplitude or in AMPA receptor gamma were observed, demonstrating that the developmental change was attributable to a decrease in the number of kainate synapses and an increase in the number of AMPA synapses contributing to transmission. Therefore, we demonstrate fundamental differences in the quantal properties for these two types of synapse. Thus, the developmental switch in transmission will dramatically alter information transfer at thalamocortical inputs to layer IV.


Figures
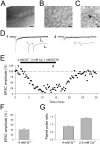
Figure 1.
Figure 1.
Extracellular Sr2+ desynchronizes release at thalamocortical synapses in developing barrel cortex. A, Low-power infrared DIC image of the barrel cortex in a thalamocortical slice in the recording chamber. Scale bar, 100 μm. B, High-power infrared DIC image of a neuron in barrel cortex during a patch-clamp recording. Scale bar, 10 μm. C, Biocytin-filled cell in layer IV neonatal barrel cortex. Scale bar, 10 μm. For A-C, pial surface is located toward the top. D, Example EPSCs (single traces) evoked by stimulation in ventrobasal thalamus collected during a whole-cell patch-clamp recording from a layer IV neuron in the barrel cortex in the presence of normal extracellular solution (2.5 mm Ca2+, 0 mm Sr2+; left) and in the presence of 4 mm Sr2+ (2 mm EGTA, 0 mm Ca2+; right). Insets show averaged EPSCs from the same cell evoked by paired-pulse stimulation. E, Example experiment (same cell as in D) showing EPSC amplitude (percentage of baseline before application of Sr2+) versus time for an experiment in which 4 mm Sr2+ (2 mm EGTA, 0 mm Ca2+) was applied extracellularly. F, Summary data from 14 cells showing the reduction in EPSC amplitude with Sr2+ application. G, Summary data from eight cells showing the change in paired-pulse ratio (EPSC2/EPSC1) with Sr2+.
Figure 2.
Figure 2.
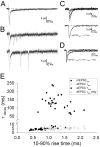
Fast-rising mEPSCs at thalamocortical synapses are mediated by a single component, where as evoked EPSCs at the same input a redual component. A, Example averaged eEPSC (in 2.5 mm Ca2+, 0 mm Sr2+) and double-exponential fit to the decay (gray). All data in A-D are from the same cell. B, Examples of two traces (not averaged) in the presence of Sr2+ (0 mm Ca2+, 2 mm EGTA) showing the synchronized eEPSC followed by evoked mEPSCfast. C, Aligned and superimposed mEPSCfast events (top) and average of these (bottom). The gray line is a single-exponential fit to the decay. D, Averaged mEPSCfast (same trace as in C) and averaged eEPSC (same trace as in A) from the same cell aligned, peak scaled, and superimposed. The gray lines are single (for mEPSCfast) and double (for eEPSC) exponential fits to the decay. E, Summary data of τdecay plotted versus 10-90% rise time for mEPSCfast (filled circles; n = 42), for dual-component eEPSCs (open diamonds, fast τdecay; filled squares, slow τdecay; n = 29), and for eEPSC with only a fast component (open triangles; n = 13).
Figure 3.
Figure 3.
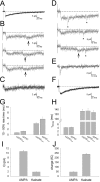
Kainate receptors mediate quantal events independently from AMPA receptors at the same population of inputs on to the same cells. A, Example averaged eEPSC (in 2.5 mm Ca2+, 0 mm Sr2+). Data in A-E are from the same cell. B, Example individual traces in the presence of Sr2+ (0 mm Ca2+, 2 mm EGTA) showing the eEPSC followed by evoked mEPSCslow (indicated by arrows). C, Averaged mEPSCslow and single-exponential fit of the decay (gray). D, Example individual traces in the presence of Sr2+ (0 mm Ca2+, 2 mm EGTA) showing the eEPSC followed by evoked mEPSCfast (indicated by asterisks; note that both mEPSCfast and mEPSCslow events are evident in the bottom trace). E, Averaged mEPSCfast and single-exponential fit to the decay (gray). F, Averaged eEPSCslow and single-exponential fit to the decay (gray). G, Values for 10-90% rise time: left, mEPSCfast (n = 42), eEPSC (n = 42); and right, mEPSCslow (n = 10) and eEPSCslow (n = 10). H, τdecay values: left, mEPSCfast (n = 42) and the fast component of eEPSC (n = 42); right, mEPSCslow (n = 6), eEPSCslow (n = 9), and the slow component of eEPSC (n = 29). I, Summary data of the mean quantal amplitude (Q) of AMPA (n = 42) and kainate (n = 13) receptor-mediated evoked mESPCs. J, Summary data for the mean charge carried by the two types of evoked mEPSCs (AMPA, n = 42; kainate, n = 6).
Figure 4.
Figure 4.
Blockade of glutamate transport does not reveal a slow component to mEPSCfast. A, Example EPSC traces from a cell in normal extracellular medium (2.5 mm Ca2+, 0 mm Sr2+; top averaged trace), in Sr2+ (0 mm Ca2+, 2 mm EGTA; middle single trace), and Sr2+ plus TBOA (0 mm Ca2+, 2 mm EGTA, 20 μm TBOA; bottom single trace). B, Averaged evoked mEPSCfast in Sr2+ (left), Sr2+ plus TBOA (middle), and scaled and superimposed (right). Gray lines are single-exponential fits. C, Summary data for mEPSCfastτdecay and 10-90% rise time (left) and amplitude (right) in the presence of Sr2+ (black; n = 8) and in Sr2+ plus TBOA (gray; n = 8).
Figure 5.
Figure 5.
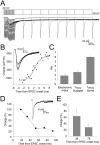
Voltage-jump analysis reveals that channels with slow kinetics underlie the kainate receptor-mediated EPSC. A, Superimposed currents (bottom) recorded from a cell in response to the superimposed voltage-jump protocol (top). For each trace, a single jump from -60 to -90 mV was applied during the AMPA or kainate receptor-mediated component of the EPSC. B, Charge recovery curve for the fast AMPAR-mediated component to the EPSC. The line is a sigmoidal fit to the data (see Materials and Methods). Inset, Superimposed traces showing the early fast component of the EPSC after subtraction of the capacitance transients illustrating the charge recovery during the AMPAR-mediated EPSC. C, Summary data from all cells (n = 5) for electrotonic index and τdecay of the synaptic conductance (both derived from the sigmoidal fit to the charge recovery data as in B) and τdecay of the AMPAR-mediated EPSCfast as recorded at the soma. D, Charge recovery during the kainate receptor-mediated component of the EPSC for an example cell (charge recovery estimated as the difference between the peak amplitude of the recovered current relative to the slow exponential decay of the kainate receptor-mediated component and normalized to charge recovered at 18 ms). Inset, Example EPSC (capacitance transient subtracted) showing charge recovery for the slow kainate receptor-mediated component at 78 ms after EPSC onset. The line is a biexponential fit to the decay of the EPSC. E, Charge recovery (normalized to recovery at 18 ms) for the kainate receptor-mediated component at 38 and 78 ms after EPSC onset for all cells in which this analysis could be performed (n = 4).
Figure 6.
Figure 6.
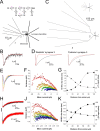
Modeling indicates that low-conductance channels with slow kinetics underlie the kainate receptor-mediated EPSC. A, Diagram of the model neuron with one explicitly modeled dendrite and four lumped dendrites. A patch electrode located on the soma is indicated, as is the position of three synapses at different electrotonic locations. Inset at top, Kinetic scheme used for the channels underlying the synaptic conductance. B, AMPAR-mediated simulated mean EPSC (red) from synapse 1 (at 15 μm from soma) generated by the realistic model and superimposed on an experimentally recorded evoked AMPAR-mediated mEPSC. C, The extreme model neuron that was generated to produce slow simulated EPSCs from fast AMPAR-like currents applied at synapse 3. Inset at top, Realistic model shown at the same scale for comparison. D, Simulated EPSC (red) generated by a fast AMPAR-like EPSC injected at synapse 3 superimposed on the slow kainate receptor-like simulated EPSC (black) for the realistic model (left) and extreme model (right). E, Superimposed simulated AMPAR-mediated EPSCs when recorded using the simulated patch electrode from the realistic model from synapses located at 0 μm (orange), 15 μm (yellow), 31 μm (green), 50 μm (blue), 77 μm (dark blue), and 100 μm (purple) from the soma. The EPSC at the soma not filtered by the recording electrode from a synapse located at 0 μm (perfectly clamped; red) is also shown for comparison. F, Binned squared difference current (variance) plotted versus current amplitude from peak to the end of the simulated AMPAR-mediated EPSCs obtained from synapses at 0, 15, 31, 50, 77, and 100 μm and the unfiltered currents (same colors as for E; 200 traces used for each data set; lines are parabolic fits to the data). G, The 10-90% rise time of simulated AMPAR-mediated EPSC (circles) and estimated γ (triangles; expressed as percentage of input value) plotted versus location of synapse. Lines are sigmoidal fits to the data. H, Simulated mean EPSC (red) from synapse 1 generated by the realistic model using the kainate receptor kinetic scheme (slow kinetics, small γ) and superimposed on an experimentally recorded evoked kainate receptor-mediated EPSC. I-K, Analysis of the effects of electrotonic location on NSFA of simulated kainate receptor-mediated EPSCs (as for E-G).
Figure 7.
Figure 7.
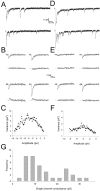
Estimation of the single-channel conductance (γ) of AMPA receptors at thalamocortical synapses using NSFA of mEPSCfast. A, Example of eEPSC and mEPSCfast evoked in the presence of Sr2+ from a cell that exhibited a high γ value. All data in A-C are from the same cell. B, Four individual evoked mEPSCfast superimposed on the peak scaled mean waveform obtained from an average of mEPSCfast (top trace for each of the four pairs). The difference current for each is shown below. C, Binned squared difference current (variance) plotted versus current amplitude from the peak to the end of the EPSC obtained from a number of mEPSCfast in this cell. The solid line is a parabolic fit to the data, with 95% confidence intervals indicated by dashed lines (r2 = 0.97; single-channel current, -1.56 ± 0.13 pA for this fit). D-F, Data from a second example cell exhibiting low γ (note that the synchronous eEPSC is off scale in the traces in D). For the parabolic fit, r2 = 0.99; single-channel current, -0.453 ± 0.058 pA. G, Frequency histogram for AMPA receptor γ obtained from mEPSCfast in 35 cells.
Figure 8.
Figure 8.
Summary of single-channel properties of AMPA receptors at developing thalamocortical synapses. A, mEPSCfast 10-90% rise time plotted versus γ for all cells (n = 35). B, mEPSCfastτdecay plotted versus γ for all cells (n = 35). The line is a linear regression, and τdecay is weakly but significantly correlated with γ (r = 0.389; p < 0.05). C, mEPSCfast amplitude plotted versus γ for all cells (n = 35). D, Estimated number of channels contributing to mEPSCfast plotted versus γ for all cells (n = 35). The line is a fit to the data of the following form: number of channels = Q/γ× 0.07, iterated with Q as the free parameter; Q = 1 0.3 ± 0.45 pA; r2 = 0.94. The number of channels is significantly correlated with γ (p < 0.0001).
Figure 9.
Figure 9.
Single-channel properties of synaptically activated kainate receptors. A, Example of individual eEPSCslow (top; evoked by minimal stimulation in the absence of an AMPA receptor-mediated component) superimposed on the peak scaled mean eEPSCslow waveform for this cell (gray). Bottom traces are the difference currents for these traces. B, Binned squared difference current (variance) plotted versus current amplitude from the peak to the end of the EPSC obtained from a number of eEPSCslow in this cell. The solid line is a parabolic fit to the data, with 95% confidence intervals indicated by dashed lines (r2 = 0.99; single-channel current, -0.0878 ± 0.0139 pA for this fit). C, Summary data for γ for kainate receptors (n = 3) and AMPA receptors (n = 35) at thalamocortical synapses (AMPA receptor data plotted from the same data set as shown in Figs. 7, 8).
Figure 10.
Figure 10.
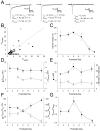
Developmental regulation of the quantal contribution of AMPA and kainate receptor-mediated transmission at the thalamocortical input. A, Examples of mean eEPSCs from three different cells showing the exponential fit to the decay (gray lines) and the decay time constants. The quantal amplitude (Q) of the AMPA (QAMPA) and kainate (Qkainate) components estimated from the evoked mEPSCs from the same cells is shown, and the calculated mean quantal content (the number of quanta released per trial; m) for each component is given. B, Summary data plotting mkainate versus mAMPA for the eEPSC in all cells (dashed line is the line of unity). Black circles represent cells in which Qkainate could not be determined, so mkainate was determined using the mean Qkainate value (n = 29); gray circles represent cells in which values for both QAMPA and Qkainate could be determined (n = 13), and mean value for all data pooled is also plotted (open circle). C, Developmental profile for the amount of charge carried by the kainate receptor-mediated component of the eEPSC (expressed as percentage of total EPSC charge; P2-P3, n = 5; P4, n = 12; P5, n = 10; P6-P7, n = 6; P8, n = 7; P9, n = 2). D, Developmental profiles for QAMPA (filled circles; P2-P3, n = 5; P4, n = 12; P5, n = 10; P6-P7, n = 6; P8-P9, n = 9) and Qkainate (open circles; note that no estimate for Qkainate was obtained for P2-P3; P4, n = 3; P5, n = 7; P6-P7, n = 2; P8-P9, n = 1). For this and subsequent panels, data for P2-P3, P6-P7, and P8-P9 are binned together. E, Developmental profiles for synaptic AMPA receptor γ (filled circles; P2-P3, n = 2; P4, n = 12; P5, n = 8; P6-P7, n = 4; P8-P9, n = 9) and number of channels (open circles; P2-P3, n = 2; P4, n = 12; P5, n = 8; P6-P7, n = 4; P8-P9, n = 9).F, Developmental profiles for mAMPA expressed as a ratio of total m (filled circles, solid lines; P2-P3, n = 5; P4, n = 12; P5, n = 10; P6-P7, n = 6; P8-P9, n = 9) and mkainate as a ratio of total m (open circles, dashed lines; P2-P3, n = 5; P4, n = 12; P5, n = 10; P6-P7, n = 6; P8-P9, n = 9). G, Developmental profile for mkainate/mAMPA (P2-P3, n = 5; P4, n = 12; P5, n = 10; P6-P7, n = 6; P8-P9, n = 9).

Similar articles

Cited by

References

    1. Abdul-Ghani MA, Valiante TA, Pennefather PS (1996) Sr2+ and quantal events at excitatory synapses between mouse hippocampal neurons in culture. J Physiol (Lond) 495: 113-125. - PMC - PubMed
    1. Agmon A, Connors BW (1991) Thalamocortical responses of mouse somatosensory (barrel) cortex in vitro. Neuroscience 41: 365-379. - PubMed
    1. Bannister NJ, Nelson JC, Jack JJ (2002) Excitatory inputs to spiny cells in layers 4 and 6 of cat striate cortex. Philos Trans R Soc Lond B Biol Sci 357: 1793-1808. - PMC - PubMed
    1. Benke TA, Lüthi A, Isaac JTR, Collingridge GL (1998) Modulation of AMPA receptor unitary conductance by synaptic activity. Nature 393: 793-797. - PubMed
    1. Benke TA, Lüthi A, Palmer MJ, Wikström M, Anderson WW, Isaac JTR, Collingridge GL (2001) Mathematical modeling of non-stationary fluctuation analysis of synaptic AMPA receptors in branched structures. J Physiol (Lond) 537: 407-420. - PMC - PubMed

Publication types

MeSH terms

LinkOut - more resources