

Pharmacodynamic modeling of the evolution of levofloxacin resistance in Staphylococcus aureus
- PMID: 15917512
- PMCID: PMC1140504
- DOI: 10.1128/AAC.49.6.2189-2199.2005
Pharmacodynamic modeling of the evolution of levofloxacin resistance in Staphylococcus aureus
Abstract
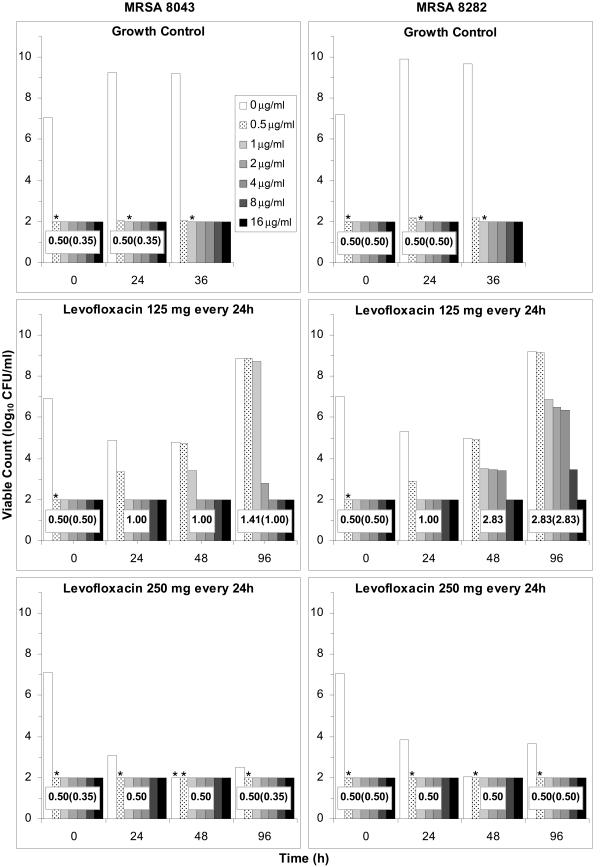
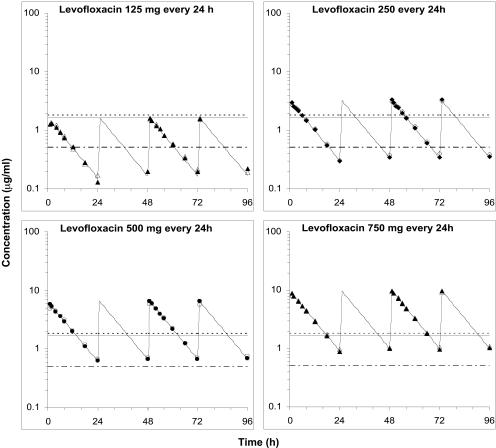
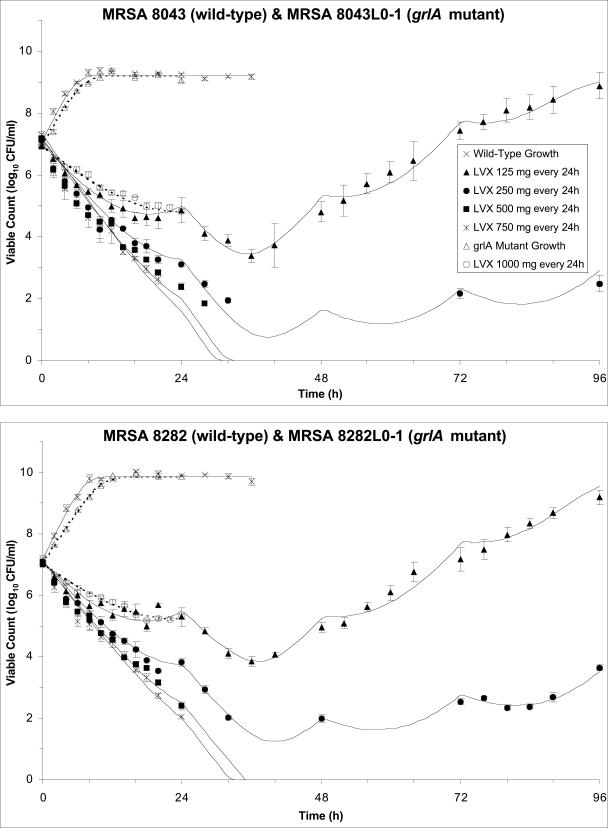
Previously, we demonstrated the importance of low-level-resistant variants to the evolution of resistance in Staphylococcus aureus exposed to ciprofloxacin in an in vitro system and developed a pharmacodynamic model which predicted the emergence of resistance. Here, we examine and model the evolution of resistance to levofloxacin in S. aureus exposed to simulated levofloxacin pharmacokinetic profiles. Enrichment of subpopulations with mutations in grlA and low-level resistance varied with levofloxacin exposure. A regimen producing average steady-state concentrations (Cavg ss) just above the MIC selected grlA mutants with up to 16-fold increases in the MIC and often additional mutations in grlA/grlB and gyrA. A regimen providing Cavg ss between the MIC and the mutant prevention concentration (MPC) suppressed bacterial numbers to the limit of detection and prevented the appearance of bacteria with additional mutations or high-level resistance. Regimens producing Cavg ss above the MPC appeared to eradicate low-level-resistant variants in the cultures and prevent the emergence of resistance. There was no relationship between the time concentrations remained between the MIC and the MPC and the degree of resistance or the presence or type of mutations that appeared in grlA/B or gyrA. Our pharmacodynamic model described the growth and levofloxacin killing of the parent strains and the most resistant grlA mutants in the starting cultures and correctly predicted conditions that enrich subpopulations with low-level resistance. These findings suggest that the pharmacodynamic model has general applicability for describing fluoroquinolone resistance in S. aureus and further demonstrate the importance of low-level-resistant variants to the evolution of resistance.
Figures
References
-
- Baquero, F., M. C. Negri, M. I. Morosini, and J. Blazquez. 1998. Antibiotic-selective environments. Clin. Infect. Dis. 27(Suppl. 1):S5-S11. - PubMed
-
- Baquero, F., M. C. Negri, M. I. L. Morosini, and J. Blazquez. 1997. The antibiotic selective process: concentration-specific amplification of low-level resistant populations, p. 93-111. In S. B. Levy (ed.), Antibiotic resistance: origins, evolution, selection and spread. John Wiley & Sons, New York, N.Y. - PubMed
-
- Burnham, K. P., and D. R. Anderson. 2002. Model selection and multimodel inference: a practical information-theoretic approach, 2nd ed. Springer, New York, N.Y.
Publication types
MeSH terms
Substances
Grants and funding
LinkOut - more resources
Full Text Sources
