A phase I/II trial of oxidized autologous tumor vaccines during the "watch and wait" phase of chronic lymphocytic leukemia
- PMID: 15918075
- PMCID: PMC11034307
- DOI: 10.1007/s00262-004-0626-5
A phase I/II trial of oxidized autologous tumor vaccines during the "watch and wait" phase of chronic lymphocytic leukemia
Abstract
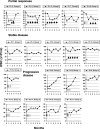
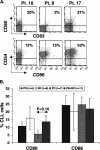
Based on their activity in patients with advanced stage chronic lymphocytic leukemia (CLL), a phase I/II study was designed to evaluate the feasibility, safety, and efficacy of autologous vaccines made from oxidized tumor cells in patients with earlier stage CLL, and to determine an optimal schedule of injections. Eighteen patients (at risk for disease progression and with white blood cell counts between 15 and 100 x 10(6) cells/ml) were injected intramuscularly with 10 ml of oxidized autologous blood (composed mainly of CLL cells) either 12 times over 6 weeks (group 1), 12 times over 16 days (group 2), or 4 times over 6 weeks (group 3). Fourteen out of eighteen patients had Rai stage 0-II disease, while 4/18 had stage III-IV disease but did not require conventional treatment. Partial clinical responses, associated with enhanced anti-tumor T cell activity in vitro, were observed in 5/18 patients of whom three were in group 2. Stable disease was observed in six patients while disease progression appeared not to be affected in the remaining patients. Toxicity was minimal. Vaccination with oxidized autologous tumor cells appears worthy of further investigation and may be a potential alternative to a "watch and wait" strategy for selected CLL patients.
Figures


Similar articles
-
Chronic lymphocytic leukemia-reactive T cells during disease progression and after autologous tumor cell vaccines.Clin Cancer Res. 2003 May;9(5):1656-65. Clin Cancer Res. 2003. PMID: 12738718
-
Molecular transfer of CD40 and OX40 ligands to leukemic human B cells induces expansion of autologous tumor-reactive cytotoxic T lymphocytes.Blood. 2005 Mar 15;105(6):2436-42. doi: 10.1182/blood-2004-07-2556. Epub 2004 Nov 9. Blood. 2005. PMID: 15536147
-
Immunotherapy with irradiated autologous leukemic cells in patients with B-CLL in early stages.Oncol Rep. 2008 Aug;20(2):443-51. Oncol Rep. 2008. PMID: 18636210
-
Vaccine- and immune-based therapy in chronic lymphocytic leukemia.Semin Oncol. 2006 Apr;33(2):220-9. doi: 10.1053/j.seminoncol.2005.12.012. Semin Oncol. 2006. PMID: 16616069 Review.
-
Immunotherapy of chronic lymphocytic leukemia.Expert Rev Anticancer Ther. 2001 Jun;1(1):73-83. doi: 10.1586/14737140.1.1.73. Expert Rev Anticancer Ther. 2001. PMID: 12113136 Review.
Cited by
-
cROSsing the Line: Between Beneficial and Harmful Effects of Reactive Oxygen Species in B-Cell Malignancies.Front Immunol. 2020 Jul 21;11:1538. doi: 10.3389/fimmu.2020.01538. eCollection 2020. Front Immunol. 2020. PMID: 32793211 Free PMC article. Review.
-
Vaccination with dendritic cells loaded with tumor apoptotic bodies (Apo-DC) in patients with chronic lymphocytic leukemia: effects of various adjuvants and definition of immune response criteria.Cancer Immunol Immunother. 2012 Jun;61(6):865-79. doi: 10.1007/s00262-011-1149-5. Epub 2011 Nov 16. Cancer Immunol Immunother. 2012. PMID: 22086161 Free PMC article.
-
Novel approaches to the immunotherapy of B-cell malignancies: An update.Curr Hematol Malig Rep. 2006 Dec;1(4):258-63. doi: 10.1007/s11899-006-0007-6. Curr Hematol Malig Rep. 2006. PMID: 20425321 Review.
-
Lymphoma immunotherapy: vaccines, adoptive cell transfer and immunotransplant.Immunotherapy. 2009 Sep;1(5):809-24. doi: 10.2217/imt.09.50. Immunotherapy. 2009. PMID: 20636025 Free PMC article. Review.
-
Toll-like Receptors in Chronic Lymphocytic Leukemia.Mediterr J Hematol Infect Dis. 2012;4(1):e2012055. doi: 10.4084/MJHID.2012.055. Epub 2012 Aug 9. Mediterr J Hematol Infect Dis. 2012. PMID: 22973499 Free PMC article.
References
-
- Caligaris-Cappio F, Hamblin TJ. B-cell chronic lymphocytic leukemia: a bird of a different feather. J Clin Oncol. 1999;17:399. - PubMed
-
- Cheson BD, Bennett JM, Grever M, Kay N, Keating MJ, O’Brien S, Rai KR. National Cancer Institute-sponsored working group guidelines for chronic lymphocytic leukemia: revised guidelines for diagnosis and treatment. Blood. 1996;87:4990. - PubMed
-
- Ribera JM, Vinolas N, Urbano-Ispizua A, Gallart T, Montserrat E, Rozman C. “Spontaneous” complete remissions in chronic lymphocytic leukemia: report of three cases and review of the literature. Blood Cells. 1987;12:471. - PubMed
-
- Ziegler-Heitbrock HW, Schlag R, Flieger D, Thiel E. Favorable response of early stage B CLL patients to treatment with IFN-alpha 2. Blood. 1989;73:1426. - PubMed
-
- Schetelig J, Thiede C, Bornhauser M, Schwerdtfeger R, Kiehl M, Beyer J, Sayer HG, Kroger N, Hensel M, Scheffold C, Held TK, Hoffken K, Ho AD, Kienast J, Neubauer A, Zander AR, Fauser AA, Ehninger G, Siegert W. Evidence of a graft-versus-leukemia effect in chronic lymphocytic leukemia after reduced-intensity conditioning and allogeneic stem-cell transplantation: the Cooperative German Transplant Study Group. J Clin Oncol. 2003;21:2747. doi: 10.1200/JCO.2003.12.011. - DOI - PubMed
Publication types
MeSH terms
Substances
LinkOut - more resources
Full Text Sources
Other Literature Sources

