. 2005 May;23(4):539-48.
doi: 10.1016/j.mri.2005.02.010.

High-resolution ultrahigh-field MRI of stroke

Affiliations

High-resolution ultrahigh-field MRI of stroke

Vera Novak et al. Magn Reson Imaging. 2005 May.

Abstract

Background: Ultrahigh-field MRI at 8 T offers unprecedented resolution for imaging brain structures and microvasculature.

Objective: The aim of this study is to apply high-resolution MRI for stroke imaging and to characterize findings at 1.5 and 8 T.

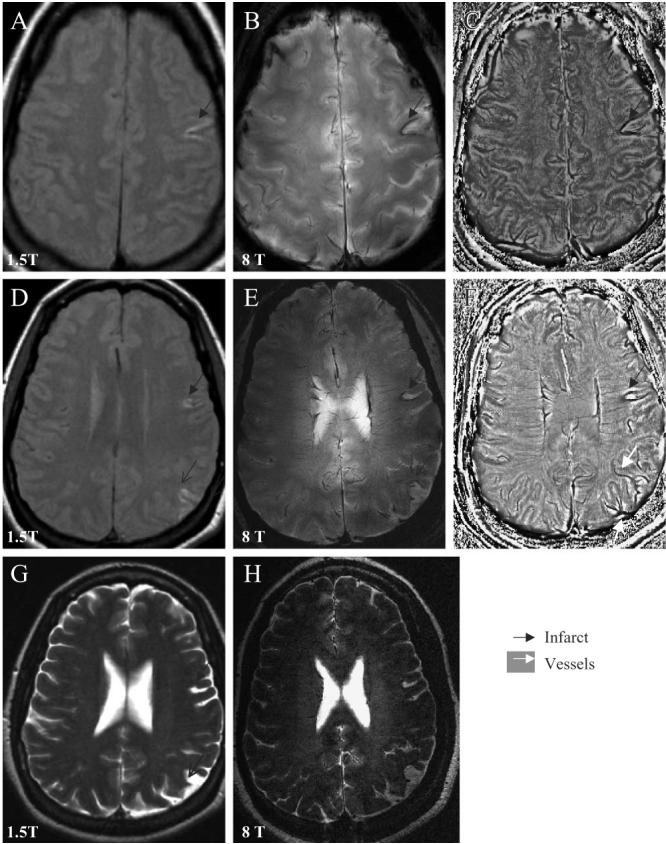
Methods: Seventeen subjects with minor ischemic infarcts were studied using T2-weighted gradient echo (GE) and rapid acquisition with relaxation enhancement (RARE) images at 8 T with resolution up to 200 microm. In 10 subjects, T1- and T2-weighted fast spin echo (FSE) and fluid-attenuated inversion recovery (FLAIR) images were also acquired at 1.5-T MRI.

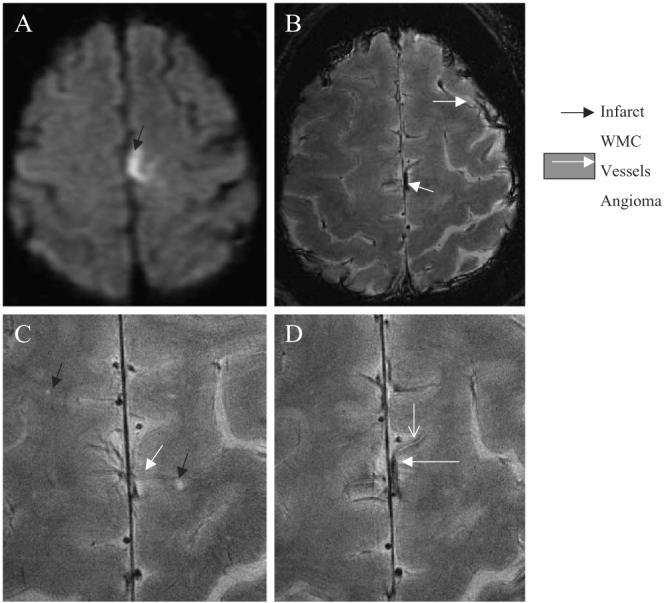
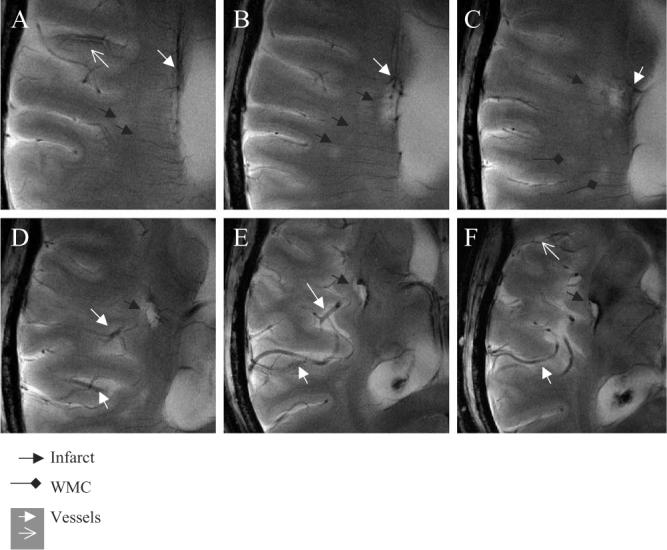
Results: The 8-T images showed infarcts as sharply demarcated areas of high-signal intensity (n=21) and revealed more infarctions than 1.5-T images (n=14) (P<.003). The low-signal intensity areas that surrounded infarctions were suggestive of hemosiderin deposits. The 8-T characteristics of microvessels terminating within the infractions were distinct from normal vasculature. The 8-T images revealed an angioma at the site of a second stroke, not apparent on 1.5-T images.

Conclusions: Ultrahigh-field MRI at 8 T is feasible for stroke imaging. The 8-T MRI visualized infarcts and microvasculature with high resolution, revealing infarcts and vascular pathologies that were not apparent at 1.5 T.


Figures

Fig. 1
Fig. 1
Axial slices through the cortex show the left temporal infarct (black arrow) with iron deposits surrounding the infarct site, the old parietal infarct (black thin arrow) on the 1.5-T T1-weighted FSE images (A, D), 8-T GE magnitude images (B, E) and the corresponding phase images (C, F). Asymmetry of the vascular supply in the infarcted and noninfarcted hemispheres, and venous drainage to the left parietal infarction are better seen on the 8-T GE phase images (C, F). The 1.5-T T2-weighted FSE image (G) and 8-T RARE image (H) reveal of the left frontal, temporal (black arrow) and parietal infarcts (black thin arrow). The 8-T GE: BW=50 kHz, FOV=20×20 cm2, slice thickness=5.0 mm, TR=528.3 ms, TE=7.0 ms, matrix 512×340, flip angle=20°. The 8-T RARE: BW=69.4 kHz, FOV=20×20 cm2, slice thickness=2 mm, TR=3000 ms, TE=2 ms, matrix 512×512, flip angle=68°. The 1.5-T T1-weighted FSE: slice thickness 5 mm, TR=500 ms, TE=14 ms, FOV=22×22 cm2, matrix=256×192, number of slices=16; 1.5-T T2-weighted FSE: slice thickness=5 mm, TR=7000 ms, TE=105 ms, FOV=22×6 cm2, matrix=128×128, number of slices=16.
Fig. 2
Fig. 2
High-resolution axial 8-T GE slices display details, consolidation and venous drainage of the left temporal (A–D) and parietal infarctions (E, F), shown in Fig. 1. Infarctions with high-signal intensity are surrounded by a low-signal intensity area, suggestive of iron deposits extending into the white matter. Normal-appearing medullary veins and cortical penetrating veins are seen as signal voids (white arrow). Details of vascular patterns in the left parietal infarction are seen on slices E and F. The 8-T GE: BW=69.4 kHz, FOV=20×20 cm2, slice thickness=2.3 mm, TR=602.7 ms, TE=10.0 ms, matrix=1024×1024, number of slices=18.
Fig. 3
Fig. 3
Axial 1.5-T FLAIR image of the second subacute left hemorrhagic hemispheric infarct (A) (black arrow). High-resolution 8-T GE images (B-D) that were obtained 2 years prior to acute event show an angioma in the same location (white arrow), prominent superficial and scattered punctuate white matter changes (black arrow) (C). The angioma feeding vessel shows a high-signal intensity surrounded by a low-signal intensity rim, suggestive of iron deposits. The 8-T GE: BW=69.4 kHz, FOV=20×20 cm2, slice thickness=2.3 mm, TR=602.7 ms, TE=10.0 ms, matrix=1024×1024, N=18. The 1.5-T FLAIR: slice thickness=5 mm, TR=10000 ms, TE=140 ms, inversion time, TI=2200, matrix=192×256, number of slices=16.
Fig. 4
Fig. 4
The 1.5-T FLAIR (A) and T2-weighted FSE (C) images at the level of the ventricles were unremarkable. The 8-T GE image (B) shows the left temporal hemorrhagic infarct as a high-signal intensity area (black arrow) with a low-signal intensity boundaries. The infarction appeared larger on the 8-T RARE image (D). The 8-T GE images (E, F) show an incidental angioma (white arrow) in the right periventricular white matter that was not apparent on the 1.5-T images. The 8-T GE: BW=50 kHz, FOV=20×20 cm2, slice thickness=5 mm, TR=750 ms, TE=10 ms, matrix=512×512. The 8-T RARE: BW=50 kHz, FOV=20×20, slice thickness=5 mm, TR=750 ms, TE=10 ms, matrix=512×512. The 1.5-T FLAIR: TR=4000 ms, TE=148.5 ms. The 1.5-T T2-weighted FSE: TR=5417 ms, TE=104 ms.
Fig. 5
Fig. 5
High-resolution axial 8-T GE slices show the left temporal lacunar infarction (A–C) as high-signal intensity area and normal-appearing penetrating vessels as linear signal voids. Panel C shows the cortical vessel with inhomogeneous signal intensity (white arrow) (C). This vessel terminates in a high-signal intensity area, suggestive of the second lacunar infarction (black arrow). The normal pattern of signal void is replaced in a distal vessel segment by high-signal intensity. The 8-T RARE image (D) shows both infarctions (black arrows), cortical vessel with inhomogeneous signal (white arrow) and additional punctuate white matter changes (black diamond). Gradient echo and RARE images were acquired with the following parameters: GE: BW=69.4 kHz, FOV=20×20 cm2, slice thickness 2.3 mm, TR=600 ms, TE=10 ms, matrix 1024×1024; RARE: BW=69.4 kHz, FOV=20×20 cm2, slice thickness=2 mm, TR=3000 ms, TE=22 ms, matrix=512×512, RARE factor 4.
Fig. 6
Fig. 6
The 8-T GE slices (A–F) demonstrate vascular supply to the lacunar infarctions and vascular patterns in the infarcted region. A small vessel is seen terminating within the lacunar infarction (black arrow) (A), ending with the low-signal intensity foci (A, B). A cortical penetrating vessel with the lumen of high-signal intensity and the low-signal intensity edge (white empty arrow) is seen in this region (A, F). Punctuate areas of signal hyperintensity, suggesting white matter changes (black diamonds) and small infarctions, are seen in this area (black arrows) (A–C). Branches of the right middle cerebral artery supplying the infarcted area appeared prominent (D–F). A larger area of low signal suggestive of iron deposits extends beyond infraction into the basal ganglia. The 8-T GE: BW=50 kHz, FOV=20×20 cm2, slice thickness=3.0 mm, TR=800 ms, TE=20 ms, matrix=1024×1024 (in-plane pixel size, 195 μm).
Fig. 7
Fig. 7
An axial 8-T RARE image at the level of the ventricles shows the infarction in the left basal ganglia (black full arrow). A low-signal intensity area surrounding the infarction and two smaller areas within the infarction suggest of hemosiderin and blood product deposits (black diamond). High-signal punctuate areas within the infarct are suggestive of infarct consolidation and vacuolization (white empty arrow). Small vessels are visible within the infarction as lines of signal void (white arrow). The 8-T RARE: BW=50 kHz, FOV=20×20 cm2, slice thickness=2 mm, TR=2500 ms, TE=20 ms, matrix=512×512.

References

    1. Dobson J. Magnetic iron compounds in neurological disorders. Ann N Y Acad Sci. 2004;1012:183–92. - PubMed
    1. deGroot JC, de Leeuw FE, Ouderk M, Hofman A, Jolles J, Breteler MM. Cerebral white matter lesions and subjective cognitive dysfunction: the Rotterdam Scan Study. Neurology. 2001;56:1539–41. - PubMed
    1. Wahlund LO, Barkhof F, Fazekas F, Bronge L, Augustin M, Sjogren M, et al. A new rating scale for age-related white matter changes applicable to MRI and CT. Stroke. 2001;32:1318–22. - PubMed
    1. Marstrand JR, Garde E, Rostrup E, Ring P, Rosenbaum S, Mortensen EL, et al. Cerebral perfusion and cerebrovascular reactivity are reduced in white matter hyperintensities. Stroke. 2002;34:972–6. - PubMed
    1. Pantoni L, Garcia JH. Pathogenesis of leukoaraoisis: a review. Stroke. 1997;28:652–9. - PubMed

Publication types