. 2005 Jul 15;566(Pt 2):455-66.
doi: 10.1113/jphysiol.2005.090258. Epub 2005 May 26.

Inverted photocurrent responses from amphibian rod photoreceptors: role of membrane voltage in response recovery

Affiliations

Inverted photocurrent responses from amphibian rod photoreceptors: role of membrane voltage in response recovery

Jaakko L P Jarvinen et al. J Physiol. .

Abstract

We recorded photocurrent responses of retinal rods isolated from cane toads Bufo marinus and clawed frogs Xenopus laevis. With the outer segment drawn part way into the suction pipette, presentation of flashes to the base of the outer segment (outside the pipette) elicited a slow inverted response. Stimulation of the same region, with the outer segment drawn fully in, gave a response of conventional polarity. For moderate to bright flashes a fast transient preceded the slow inverted response. Upon bleaching the tip of the outer segment, the slow inverted response was abolished but the fast initial transient remained, and we attribute this fast component to a capacitive current. Experiments employing simultaneous whole-cell patch-clamp and suction pipette recording revealed that both the fast and slow components of the inverted responses were absent in voltage-clamped cells. In current-clamped cells the slow inverted current response was delayed substantially with respect to the voltage response. We present a computational model for the slow component, in which hyperpolarization leads to increased activity of the Na+ -Ca2+, K+ exchanger, hence lowering the cytoplasmic Ca2+ concentration, activating guanylyl cyclase, raising cyclic GMP concentration, opening cyclic nucleotide-gated channels, and increasing circulating current in the unstimulated region. For the measured voltage response to stimulation of the base, we solve these equations to predict the photocurrent in the tip, and obtain an adequate explanation of the inverted responses. Our work suggests a novel role for membrane voltage in accelerating the inactivation phase of the response to light.


Figures
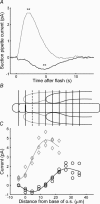
Figure 1
Figure 1. Inverted responses and their spatial profile, in suction pipette recordings from a Bufo marinus rod
The outer segment was first drawn part way into the suction pipette and then drawn in fully. A, traces are averages of 30 responses to slit-shaped flash stimuli (nominal width 3 μm) presented at the base of the outer segment as indicated by the dashed line in panel B (intensity 3.7 photons μm−2). B, the shadings used for the pipette outlines designate the recording configurations for the traces and symbols in A and C. Vertical lines, plotted using the horizontal axis of panel C, indicate the centre positions of the slit stimulus (nominal width 3 μm), which was moved in steps of 4.4 μm. C, response profiles of the outer segment (o.s.), when drawn in to the two positions indicated schematically in B (grey traces and diamonds, outer segment fully in; black traces and circles, outer segment part way in). Curves are arbitrary polynomials fitted to the data points using a least-squares algorithm. Each symbol corresponds to the average amplitude of 10 responses. The amplitudes were determined by measuring the average size of the responses over a 0.5 s time window chosen to coincide with the peak; the time windows were 1.8–2.3 s for the ‘conventional’ responses (grey) and 4.5–5.0 s for the responses with the outer segment partly drawn in (black), as shown by the markers in A.
Figure 2
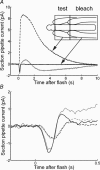
Figure 2. Effect of local bleaching on inverted response in a Bufo marinus rod
A, the outer segment was drawn part way in. Flashes (17.4 photons μm−2, or ca 120 photoisomerisations (R*) per flash, nominal slit width 20 μm) targeted to the unrecorded part of the outer segment elicited an inverted response in the dark-adapted state (grey trace; mean of 30 responses). After bleaching of the tip (about 0.8% of outer segment's total rhodopsin per bleach), only the fast transient remained (black trace; mean of 120 responses). Six bleaches, each followed by a train of test flashes, were delivered at intervals of about 6 min to ensure that ion channels in the tip remained closed. At the end of the experiment, the outer segment was drawn all the way in, the tip was bleached again (three times) and responses to basal flashes were recorded (interrupted trace; mean of 61 responses). By the end of the experiment, the nine bleaches had isomerized about 7% of the total rhodopsin (or about 14% of that in the tip region). B, the outer segment of another cell was drawn part way in. Traces are recordings (on a faster time-base) of the current from the tip of the outer segment, in response to flashes at the base. Two intensities were used, 17 and 66 photons μm−2 (ca 150 and 560 R* per flash, dashed and continuous traces, respectively; nominal slit width 16 μm), both before (grey) and after (black) localized bleaching of the tip. Three exposures were given, each bleaching about 1% of the total rhodopsin, and each was followed by a train of test flashes. Traces are averages of 30 responses, except grey continuous trace, which is the average of 10 responses.
Figure 3
Figure 3. Effect of voltage clamping on inverted responses in a Xenopus rod
A, photomicrograph of a combined suction pipette and patch clamp recording. The bright rectangular patch in the middle indicates the location and the dimensions of the flash stimulus (65 photons μm−2, or ca 230 R* per flash; slit width was about 15 μm, but the length of outer segment illuminated was only about 10 μm, because part of the stimulus was on the inner segment). The patch pipette (bottom right) was sealed against the inner segment. Calibration bar (top right) is 20 μm. B, current responses recorded from the tip of the outer segment with the suction pipette. Grey trace is from a voltage-clamped rod; the black trace was obtained from the same cell under current-clamp conditions. Traces are averages of 10 responses obtained as two separate trains of five responses, and are digitally low-pass filtered (5 Hz Gaussian). Much of the recorded noise is attributable to the Johnson thermal noise across the resistance of the loose seal between the suction pipette and the cell membrane. Calculated s.d. of current noise for a leakage resistance of 8 MΩ and bandwidth of 5 Hz is 0.1 pA; averaged from 10 traces, the expected peak-to-peak noise would be ∼0.2 pA.
Figure 4
Figure 4. Reversibility of the effect of voltage clamping in a Xenopus rod
The cell, the light stimulus and the filtering parameters are the same as in Fig. 3. A, inverted response in an intact rod about 13 min before obtaining a whole-cell recording configuration. B, response during voltage clamp 1 min after obtaining a whole-cell recording configuration. C, response during current clamp, about 2.5 min after obtaining a whole-cell recording configuration. The smaller size of the response (compared with A) can be attributed to slight running-down of the cell due to dialysis of the cell by the whole-cell pipette. D, response after returning to voltage clamp, about 4.5 min after obtaining a whole-cell recording configuration. E, response after returning to current clamp, about 6.5 min after obtaining a whole-cell configuration. All traces are averages of five raw responses.
Figure 5
Figure 5. Comparison of fast transient with intracellular voltage change in Xenopus rod
A, suction pipette current under current-clamp conditions (grey) and simultaneous intracellular voltage recording (black; voltage scale on right). B, comparison of the time derivative of the voltage response (dashed curve; scale on right) with the suction pipette current (grey). Same cell as in Figs 3 and 4. Current traces are digitally low-pass filtered (10 Hz Gaussian).
Figure 6
Figure 6. Simplified molecular scheme for the inverted responses
Hyperpolarization increases the extrusion of Ca2+ by the electrogenic Na+–Ca2+,K+ exchanger (NCKX) and leads to a decrease in free [Ca2+]i. The reduction in [Ca2+]i causes the release of inhibition of guanylyl cyclase (GC) by Ca2+-bound guanylyl cyclase-activating proteins (GCAPs; for molecular detail, see review by Dizhoor, 2000). The active guanylyl cyclase increases the cytoplasmic cGMP concentration. Cyclic GMP increases the opening probability of cyclic nucleotide-gated channels (CNGCs). The slow component of the inverted response is the inward current through cyclic nucleotide-gated channels mediated by Na+ and Ca2+. This depolarizing current carries Ca2+ into the cell, and the increased [Ca2+]i tends to counteract the initial effect of hyperpolarization. Even in darkness, the phosphodiesterase (PDE) hydrolyses cGMP at a rate proportional to cGMP concentration.
Figure 7
Figure 7. Prediction of the inverted response from intracellular voltage in Xenopus rod
The light stimulus was restricted to the region of the outer segment outside the suction pipette, and delivered 65 photons μm−2, or ca 510 R* per flash (nominal slit width 15 μm). A, suction pipette currents under voltage clamp (grey) and current clamp (black). B, intracellular voltage response (dashed; scale on right) and suction pipette current under current clamp (black; scale on left). Grey trace is the current predicted from the voltage response using the theory of the Appendix and the parameter values of Table 1. C, after correction for scattered light. The suction pipette response under voltage clamp (presumed to reflect the scattered light response) has been subtracted from the current-clamped response to give a better estimate of the true tip response to the intracellular voltage change (black trace). The theoretical prediction is shown as the grey trace, using slightly different parameters (αmin= 0.5 μm s−1, αmax= 10 μm s−1) from Table 1. Traces are low-pass filtered at 5 Hz (Gaussian), except for the current responses in B which are filtered at 2 Hz.

Similar articles

Cited by

References

    1. Bader CR, MacLeish PR, Schwartz EA. A voltage-clamp study of the light response in solitary rods of the tiger salamander. J Physiol. 1979;296:1–26. - PMC - PubMed
    1. Baylor DA, Lamb TD. Local effects of bleaching in retinal rods of the toad. J Physiol. 1982;328:49–71. - PMC - PubMed
    1. Baylor DA, Lamb TD, Yau K-W. Responses of retinal rods to single photons. J Physiol. 1979;288:613–634. - PMC - PubMed
    1. Baylor DA, Matthews G, Nunn BJ. Location and function of voltage-sensitive conductances in retinal rods of the salamander, Ambystoma tigrinum. J Physiol. 1984;354:203–223. - PMC - PubMed
    1. Baylor DA, Nunn BJ. Electrical properties of the light-sensitive conductance of rods of the salamander Ambystoma tigrinum. J Physiol. 1986;371:115–145. - PMC - PubMed

Publication types

LinkOut - more resources