

Manipulation of peripheral neural feedback loops alters human corticomuscular coherence
- PMID: 15919711
- PMCID: PMC1464768
- DOI: 10.1113/jphysiol.2005.089607
Manipulation of peripheral neural feedback loops alters human corticomuscular coherence
Abstract
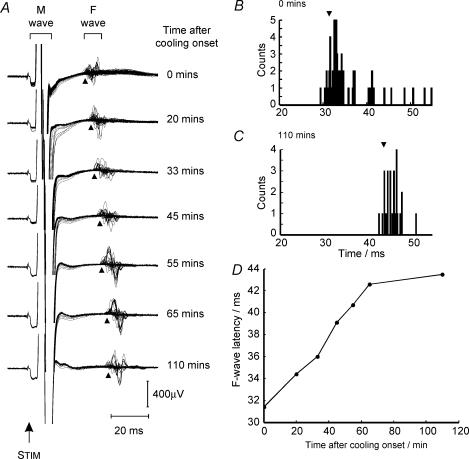
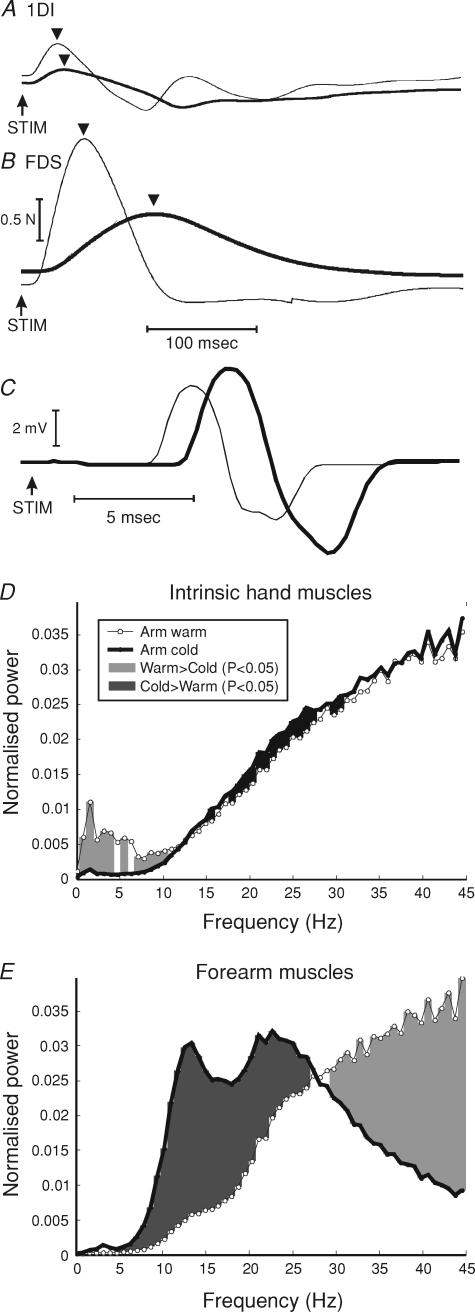
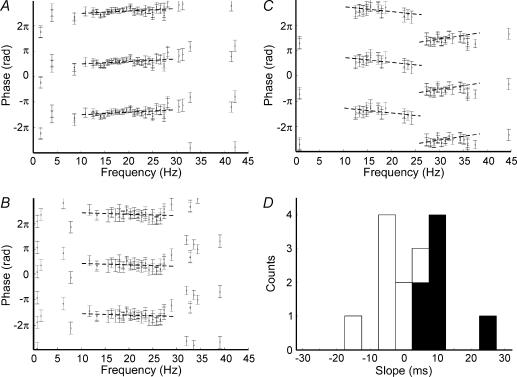
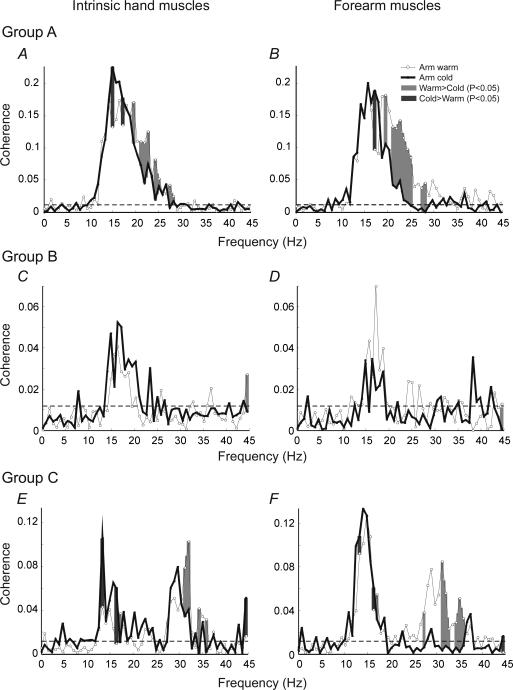
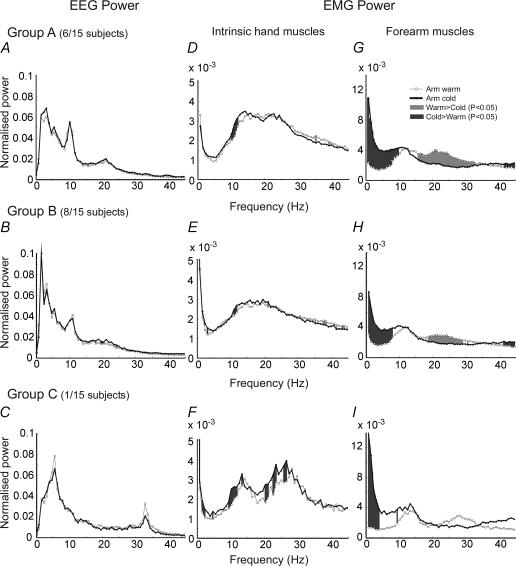
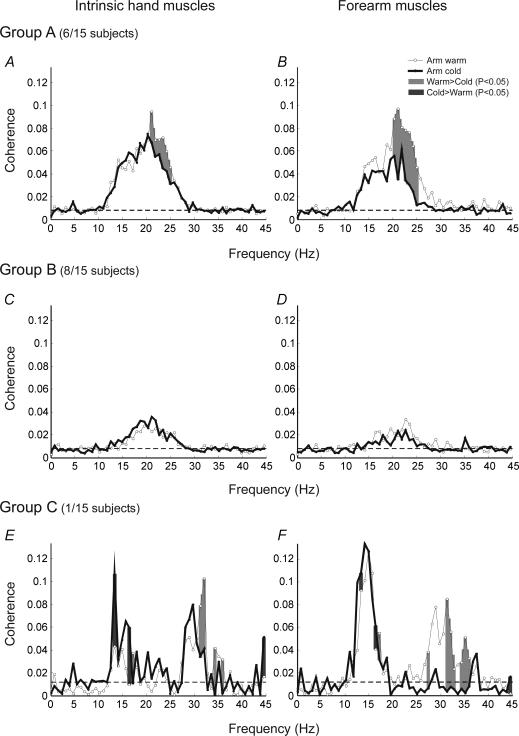
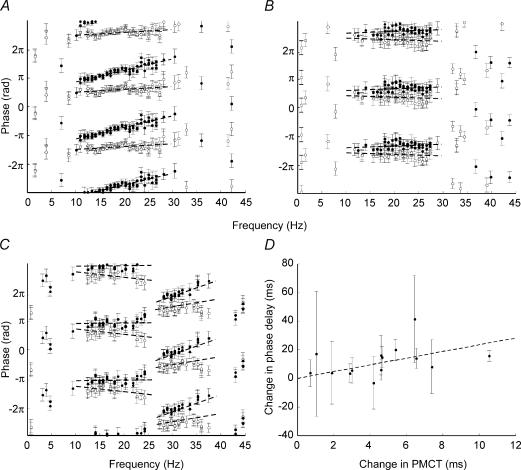
Sensorimotor EEG shows approximately 20 Hz coherence with contralateral EMG. This could involve efferent and/or afferent components of the sensorimotor loop. We investigated the pathways responsible for coherence genesis by manipulating nervous conduction delays using cooling. Coherence between left sensorimotor EEG and right EMG from three hand and two forearm muscles was assessed in healthy subjects during the hold phase of a precision grip task. The right arm was then cooled to 10 degrees C for approximately 90 min, increasing peripheral motor conduction time (PMCT) by approximately 35% (assessed by F-wave latency). EEG and EMG recordings were repeated, and coherence recalculated. Control recordings revealed a heterogeneous subject population. In 6/15 subjects (Group A), the corticomuscular coherence phase increased linearly with frequency, as expected if oscillations were propagated along efferent pathways from cortex to muscle. The mean corticomuscular conduction delay for intrinsic hand muscles calculated from the phase-frequency regression slope was 10.4 ms; this is smaller than the delay expected for conduction over fast corticospinal pathways. In 8/15 subjects (Group B), the phase showed no dependence with frequency. One subject showed both Group A and Group B patterns over different frequency ranges. Following cooling, averaged corticomuscular coherence was decreased in Group A subjects, but unchanged for Group B, even though both groups showed comparable slowing of nervous conduction. The delay calculated from the slope of the phase-frequency regression was increased following cooling. However, the size of this increase was around twice the rise in PMCT measured using the F-wave (regression slope 2.33, 95% confidence limits 1.30-3.36). Both afferent and efferent peripheral nerves will be slowed by similar amounts following cooling. The change in delay calculated from the coherence phase therefore better matches the rise in total sensorimotor feedback loop time caused by cooling, rather than just the change in the efferent limb. A model of corticomuscular coherence which assumes that only efferent pathways contribute cannot be reconciled to these results. The data rather suggest that afferent feedback pathways may also play a role in the genesis of corticomuscular coherence.
Figures
Similar articles
-
Contributions of descending and ascending pathways to corticomuscular coherence in humans.J Physiol. 2011 Aug 1;589(Pt 15):3789-800. doi: 10.1113/jphysiol.2011.211045. Epub 2011 May 30. J Physiol. 2011. PMID: 21624970 Free PMC article.
-
The effect of carbamazepine on human corticomuscular coherence.Neuroimage. 2004 May;22(1):333-40. doi: 10.1016/j.neuroimage.2003.12.040. Neuroimage. 2004. PMID: 15110023 Clinical Trial.
-
The influence of unilateral contraction of hand muscles on the contralateral corticomuscular coherence during bimanual motor tasks.Neuropsychologia. 2016 May;85:199-207. doi: 10.1016/j.neuropsychologia.2016.03.028. Epub 2016 Mar 24. Neuropsychologia. 2016. PMID: 27018484
-
Corticomuscular coherence: a review.J Clin Neurophysiol. 1999 Nov;16(6):501-11. doi: 10.1097/00004691-199911000-00002. J Clin Neurophysiol. 1999. PMID: 10600018 Review.
-
Unveiling neural coupling within the sensorimotor system: directionality and nonlinearity.Eur J Neurosci. 2018 Oct;48(7):2407-2415. doi: 10.1111/ejn.13692. Epub 2017 Oct 6. Eur J Neurosci. 2018. PMID: 28887885 Free PMC article. Review.
Cited by
-
Neural synchrony within the motor system: what have we learned so far?Front Hum Neurosci. 2012 Sep 4;6:252. doi: 10.3389/fnhum.2012.00252. eCollection 2012. Front Hum Neurosci. 2012. PMID: 22969718 Free PMC article.
-
Changes in corticospinal drive to spinal motoneurones following visuo-motor skill learning in humans.J Physiol. 2006 Jun 15;573(Pt 3):843-55. doi: 10.1113/jphysiol.2006.105361. Epub 2006 Mar 31. J Physiol. 2006. PMID: 16581867 Free PMC article.
-
Oscillatory interactions between sensorimotor cortex and the periphery.Curr Opin Neurobiol. 2007 Dec;17(6):649-55. doi: 10.1016/j.conb.2008.01.007. Epub 2008 Mar 12. Curr Opin Neurobiol. 2007. PMID: 18339546 Free PMC article. Review.
-
An open-source hardware and software system for acquisition and real-time processing of electrophysiology during high field MRI.J Neurosci Methods. 2008 Nov 15;175(2):165-86. doi: 10.1016/j.jneumeth.2008.07.017. Epub 2008 Aug 5. J Neurosci Methods. 2008. PMID: 18761038 Free PMC article.
-
Muscle responses to transcranial stimulation in man depend on background oscillatory activity.J Physiol. 2007 Sep 1;583(Pt 2):567-79. doi: 10.1113/jphysiol.2007.134031. Epub 2007 Jul 12. J Physiol. 2007. PMID: 17627997 Free PMC article.
References
-
- Baker SN, Matthews HR. Differential effect of ischaemia on the reflex electromyographic responses to stretch and electrical stimulation in the human first dorsal interosseous muscle. J Physiol. 1993;459:456P.
-
- Baker SN, Pinches EM, Lemon SN. Synchronisation in monkey motor cortex during a precision grip task. II. Effect of oscillatory activity on corticospinal output. J Neurophysiol. 2003;89:1941–1953. - PubMed
Publication types
MeSH terms
Grants and funding
LinkOut - more resources
Full Text Sources