. 2005 Aug 1;566(Pt 3):821-37.
doi: 10.1113/jphysiol.2005.089458. Epub 2005 May 26.

Cell type-specific action of seizure-induced intracellular zinc accumulation in the rat hippocampus

Affiliations

Cell type-specific action of seizure-induced intracellular zinc accumulation in the rat hippocampus

Amélie Côté et al. J Physiol. .

Abstract

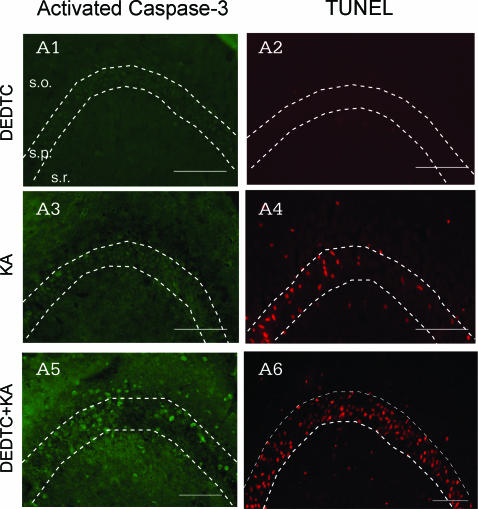
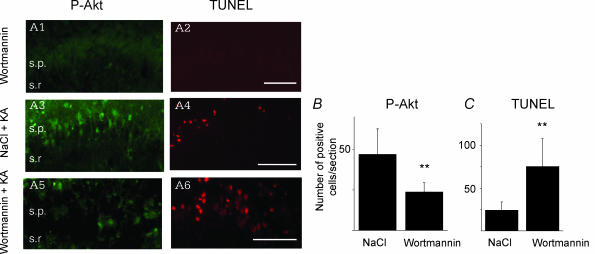
Increased levels of intracellular zinc have been implicated in neuronal cell death in ischaemia, epilepsy and traumatic brain damage. However, decreases in zinc levels also lead to increased neuronal death and lowered seizure threshold. In the present study we investigated the physiological role of zinc in neurodegeneration and protection following epileptic seizures. Cells located in the strata oriens and lucidum of the CA3 region accumulated high concentrations of zinc and died. A decrease in zinc level could prevent the death of these neurones after seizures. Most of these cells were GABAergic interneurones. In contrast, neurones in the CA3 pyramidal cell layer accumulated moderate amounts of zinc and survived. Zinc chelation led to an increase in the mortality rate of these cells. Furthermore, in these cells low concentrations of intracellular zinc activated Akt (protein kinase B), thus providing protection against neurodegeneration. These results demonstrate that intracellularly accumulated zinc can be neurotoxic or neuroprotective depending on its concentration. This dual action is cell type specific.


Figures

Figure 1
Figure 1. Distribution of cells accumulating zinc following seizures. Correlation between zinc accumulation and TUNEL labelling
Strongly labelled TSQ-positive neurones were detected 10 h after KA (kainic acid) injection in the stratum oriens of the CA3 area. The vast majority of these cells were TUNEL-positive (B, arrow), while in non-KA-treated animals neither TSQ- nor TUNEL-positive cells were visible (A). Faintly stained cells appeared 18 h after seizure induction in the str. pyramidale of the CA3 region. Most of these cells were TUNEL-negative (C, arrows). D and E, spatial distribution and TSQ intensity of TUNEL-positive (red dots) and TUNEL-negative (black dots) cells are shown at 10 (D) and 18 h (E) after kainic acid injection. The majority of TUNEL-labelled cells were located in the str. lucidum and oriens and accumulated a high concentration of zinc, while cells situated in the str. pyramidale showed faint TSQ staining and survived. F, Newport Green diacetate staining of in vitro slices prepared from animals 18 h after kainic acid injection. Slices were loaded in 5 μm NG for 30 min. Blue arrows indicate strongly labelled cells in the stratum oriens, and red arrows point to faintly labelled cells in the stratum pyramidale. Fluorescence signals were calibrated by obtaining Fmax values in the presence of 1 mm ZnCl2 plus 50 μm sodium pyrithione, and Fmin was estimated in the presence of 200 μm DEDTC. The dashed line indicates the border between str. pyramidale and oriens. G, NG fluorescent intensity measurement from 216 cells located in the str. pyramidale (blue bars) and in the str. oriens and lucidum (red bars), binning at ΔF/F= 0.01. H, the staining intensity was statistically different between cells located in the str. pyramidale and str. oriens/lucidum (P < 0.0001). Scale bar = 25 μm in A–C, 40 μm in F.
Figure 2
Figure 2. Colocalization of TUNEL and GAD following seizures
Double labelling with GAD immunocytochemistry (A) and TUNEL (B) at 10 h after kainic acid injection. Two cells in the stratum oriens of the CA3 region are TUNEL- and GAD-positive (white arrows); the arrowhead indicates a GAD-positive and TUNEL-negative neurone, and the open arrow shows a TUNEL-positive, GAD-negative cell. D and E, bar graphs indicate that the majority of TUNEL-labelled cells are GAD-positive 10 and 18 h after kainic acid injection. Data collected from 8 consecutive sections. Scale bar = 50 μm.
Figure 3
Figure 3. TSQ and TUNEL-staining 10 h after kainate injection in animals fed zinc-free diet
A and B, intracellular zinc accumulation following seizures was significantly less in animals kept on zinc-free diet compared to control rats (P < 0.05). TSQ intensity measurements in cells from control animals (A1) and those fed on a zinc-free diet (A2). Both cells are situated in the stratum oriens of the CA3 region. Quantitative analysis indicated that in animals kept on zinc-free diet, the TSQ intensity was decreased by 52% compared to controls. Data collected from 10 consecutive sections from each animal. In non-KA-injected animals following zinc-free diet, no TSQ- or TUNEL-labelled cells were observed (C, zinc-free diet). Ten hours post-injection only very few TSQ and TUNEL-positive interneurones were observed in rats following zinc-free diet (C, zinc-free diet + KA) compared to control KA-injected animals (C, KA). D, statistical analysis of the number of double and TSQ or TUNEL-labelled neurones in the CA3 region, showing the number of labelled cells in 10 consecutive sections. Dashed lines indicate the borders of str. pyramidale. Scale bars = 50 μm on C.
Figure 4
Figure 4. TSQ and TUNEL staining 18 h after kainate injection in DEDTC-treated animals
A, the experimental design of zinc-chelation experiments. B, CA3 region of the hippocampus with no detectable zinc in the mossy fibres revealed by TSQ staining at 30 min after the first DEDTC injection. In non-KA-injected DEDTC-treated animals, no TSQ- or TUNEL-labelled cells were observed (C, DEDTC). Zinc chelation significantly decreased the number of TSQ-positive pyramidal cells in the CA3 region, but the number of TUNEL-labelled cells was dramatically increased (C, DEDTC + KA) compared to control KA-injected animals (C, KA). D, statistical analysis of the number of double- and TSQ- or TUNEL-labelled neurones in the CA3 region showing the number of labelled cells in 5 consecutive sections. Dashed line indicates the border of str. lucidum and pyramidale. Scale bars = 100 μm in B; 50 μm in C.
Figure 5
Figure 5. Expression of Akt and P-Akt in normal and zinc-deficient animals following kainic acid-induced epilepsy
While Akt immunostaining could not be detected in control animals (A, CA3 region), at 6 h after epileptic seizures, a dramatic increase in Akt level in the CA3-hilar region was observed (B). Zinc-free diet alone caused a minimal increase in Akt-level (C, CA3 region); KA injection in animals kept on zinc-free diet resulted in Akt staining similar to control KA-treated animals (D). E–H, P-Akt immunostaining from control animals and from rats following zinc-free diet. Photomicrographs were taken from the CA3 region of the hippocampus. P-Akt was not detected in non-epileptic control animals (E) or in animals fed a zinc-free diet (F). Following KA-induced seizures, in control animals P-Akt level increased in the CA3 stratum pyramidale but not in other layers (G). In rats kept on zinc-free diet, significantly fewer cells in the stratum pyramidale were stained, but the number of P-Akt-positive cells in other layers increased (arrows) (H). Dashed lines indicate the borders of str. pyramidale. I and J, differences in the spatial distribution of 100 P-Akt cells in the CA3 region from control rats (I) and animals kept on zinc-free diet (J). Data collected from 4 different animals. P-Akt-positive cells are concentrated in the stratum pyramidale in control rats, while in animals kept on zinc-free diet P-Akt-labelled cells were found in every layer. K, the Kolmogorov-Smirnov test showed significant differences (P < 0.001) in the cumulative probability distribution of the two groups. Scale bar = 100 μm in A, C and D, 400 μm in B and 200 μm in E–H.
Figure 6
Figure 6. Activated caspase3 and TUNEL staining 3 days after kainate injection
Comparison of activated caspase-3 and TUNEL staining in the CA3 region of normal and DEDTC-treated animals following KA injection. DEDTC treatment alone did not increase the number of activated caspase-3 or TUNEL stained cells (A and B). Three days after the kainic acid injection the number of activated caspase-3 and TUNEL-labelled cells in DEDTC-treated animals was increased when compared to control epileptic animals (C–F). Dashed lines indicate the borders of str. pyramidale. Scale bar = 100 μm.
Figure 7
Figure 7. The effect of wortmannin injection on CA3 pyramidal cell survival
P-Akt immunostaining and TUNEL labelling in the CA3 region of wortmannin-injected epileptic and non-epileptic animals and in vehicle-injected epileptic rats. For P-Akt immunostaining, animals were killed 6 h after kainic acid injection, while TUNEL labelling was investigated 3 days after kainic acid injection. Intraventricular injection of wortmannin alone did not cause the appearance of P-Akt or TUNEL-positive neurones (A1 and 2). In KA-injected animals, it reduced significantly the number of P-Akt-positive cells (A5), compared to control KA-treated animals injected with vehicle (A3 and B). The number of TUNEL-positive, dying neurones was significantly increased in wortmannin-injected rats (A4 and 6 and C). Data collected from 15 consecutive sections from each animal. Scale bars = 100 μm.

Similar articles

Cited by

References

    1. Aizenman E, Stout AK, Hartnett KA, Dineley KE, Mclaughlin B, Reynolds IJ. Induction of neuronal apoptosis by thiol oxidation: putative role of intracellular zinc release. J Neurochem. 2000;75:1878–1888. - PubMed
    1. Allington C, Shamovsky IL, Ross GM, Riopelle RJ. Zinc inhibits p75NTR-mediated apoptosis in chick neural retina. Cell Death Differ. 2001;8:451–456. - PubMed
    1. Andrews JC, Nolan JP, Hammerstedt RH, Bavister BD. Characterization of N-(6-methoxy-8-quinolyl)-p-toluenesulfonamide for the detection of zinc in living sperm cells. Cytometry. 1995;21:153–159. - PubMed
    1. Assaf SY, Chung SH. Release of endogenous Zn2+ from brain tissue during activity. Nature. 1984;308:734–736. - PubMed
    1. Berendji D, Kolb-Bachofen V, Meyer KL, Grapenthin O, Weber H, Wahn V, Kroncke KD. Nitric oxide mediates intracytoplasmic and intranuclear zinc release. FEBS Lett. 1997;405:37–41. - PubMed

Publication types

MeSH terms