. 2005 Aug 1;566(Pt 3):747-58.
doi: 10.1113/jphysiol.2005.089276. Epub 2005 May 26.

Visualization of transmitter release with zinc fluorescence detection at the mouse hippocampal mossy fibre synapse

Affiliations

Visualization of transmitter release with zinc fluorescence detection at the mouse hippocampal mossy fibre synapse

Jing Qian et al. J Physiol. .

Abstract

Exocytosis of synaptic vesicle contents defines the quantal nature of neurotransmitter release. Here we developed a technique to directly assess exocytosis by measuring vesicular zinc release with the zinc-sensitive dye FluoZin-3 at the hippocampal mossy fibre (MF) synapse. Using a photodiode, we were able to clearly resolve the zinc fluorescence transient ([Zn2+]t) with a train of five action potentials in mouse hippocampal brain slices. The vesicular origin of [Zn2+]t was verified by the lack of zinc signal in vesicular zinc transporter Znt3-deficient mice. Manipulating release probability with the application of neuromodulators such as DCG IV, 4-aminopyridine and forskolin as well as a paired train stimulation protocol altered both the [Zn2+]t and the field excitatory postsynaptic potential (fEPSP) coordinately, strongly indicating that zinc is co-released with glutamate during exocytosis. Since zinc ions colocalize with glutamate in small clear vesicles and modulate postsynaptic excitability at NMDA and GABA receptors, the findings establish zinc as a cotransmitter during physiological signalling at the mossy fibre synapse. The ability to directly visualize release dynamics with zinc imaging will facilitate the exploration of the molecular pharmacology and plasticity of exocytosis at MF synapses.


Figures

Figure 1
Figure 1. Fluorescence signal of zinc-sensitive dye FluoZin-3 evoked by a train of stimuli
Fluorescence signal of FluoZin-3 recorded in the stratum lucidum in response to a train of 20 stimulation pulses (33 Hz). A, schematic diagram of a hippocampal slice showing stimulating and recording sites (Inset: sample traces of raw fluorescence signal of FluZin-3 in response to experimental protocol with or without stimulation of mossy fibres. B, time course of basal fluorescence intensity and peak amplitude of the transient fluorescence change ([Zn2+]t) in response to application of FluoZin-3, CNQX +d-APV, and DCG IV. Inset shows sample traces of [Zn2+]t and the corresponding field excitatory postsynaptic potential (fEPSP) which exhibits a typical mossy fibre response with a steep short-term facilitation of release. The [Zn2+]t was unrelated to postsynaptic activity since the glutamate receptor antagonists CNQX (10 μm) and d-APV (25 μm) did not affect the [Zn2+]t. In contrast, [Zn2+]t was sensitive to the presynaptic type II mGluR receptor agonist DCG IV (1 μm). This indicates that the [Zn2+]t was not an artifact of light scattering as a result of postsynaptic activity. The blockade of [Zn2+]t with DCG IV is consistent with the hypothesis that zinc is released during vesicular exocytosis from presynaptic terminals.
Figure 2
Figure 2. [Zn2+]t is not an artifact of light scattering but reflects accumulation of extracellular zinc
A, time course of basal fluorescence intensity in response to application of FluoZin-2 and FluoZin-3. Sample traces show [Zn2+]t obtained with low affinity zinc indicator FluoZin-2 marked as ‘a’ and high affinity zinc indicator FluoZin-3 marked as ‘b’. Absence of [Zn2+]t signal using the low affinity indicator in ‘a’ excluded the possibility that [Zn2+]t in ‘b’ was contributed by light scattering. B, left panels, time course of basal FluoZin-3 fluorescence in response to different concentrations of slow zinc chelator Ca-EDTA (upper panel) and fast chelator EDDA (lower panel). Reduction of basal FluoZin-3 fluorescence by zinc chelators indicates the existence of free extracellular zinc. Insets (right) show sample traces (a–d) taken in control and in the presence of varying concentrations of zinc chelators: Ca-EDTA (upper panel) and EDDA (lower panel). Both altered the peak amplitude as well as the decay phase of [Zn2+]t in a concentration-dependent manner. C, sample traces of [Zn2+]t and fEPSP evoked by a train of 5 stimuli at 33 Hz in the presence of different strengths of zinc chelation. Increasing concentrations of EDDA decreased the amplitude of [Zn2+]t, and shortened the time to reach peak amplitude. The latency of the [Zn2+]t peak response was measured from the last fEPSP as marked by the dashed line. D, summary data of peak amplitude and delay of [Zn2+]t in response to application of 200 μm Ca-EDTA, and 5, 25 and 125 μm EDDA.
Figure 3
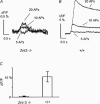
Figure 3. Lack of vesicular zinc release in zinc transporter Znt3-deficient mice
A and B, sample traces of [Zn2+]t evoked by a train of 5, 10 and 20 stimulation pulses (33 Hz) in the presence of 200 μm Ca-EDTA from Znt3−/− mice (A, n = 4) are compared with +/+ mice (B, n = 6) shown at 1/10th scale, revealing dependence of [Zn2+]t on zinc content of mossy fibre vesicles. C, summary data of [Zn2+]t evoked by a train of 20 APs.
Figure 4
Figure 4. [Zn2+]t reflects glutamate release at the mossy fibre synapse
A, time course of the peak amplitude of [Zn2+]t and summation of the fEPSP slope in response to application of 5 μm 4-AP (n = 5). Insets show sample traces of [Zn2+]t and fEPSP taken before and during steady state of 4-AP application. B, time course of the peak amplitude of [Zn2+]t and summation of fEPSP slope in response to application of 50 μm forskolin (n = 5). Insets show sample traces of [Zn2+]t and fEPSP taken in control and at the peak of forskolin action. C, left: superimposed [Zn2+]t evoked by a pair of trains separated by an interval of 0.1 s, 1 s and 2 s, respectively; right: the 1st fEPSP (top trace) and the corresponding 2nd fEPSP (lower traces) within a pair of trains obtained at the different intervals. [Zn2+]t and fEPSP obtained with application of DCG IV in the same experiment are also shown. D, summary of data showing correlation of [Zn2+]t and fEPSP facilitation versus the time interval between paired trains. E, summary plot of [Zn2+]tversus fEPSP from experiments with paired train protocol and application of the release-modulating agents 4-AP, DCG IV and forskolin, indicating a good correlation between [Zn2+]t and glutamate release over an extended range of release probability.
Figure 5
Figure 5. Zinc release evoked by individual action potentials
A, averaged trace (n = 20) of [Zn2+]t evoked by a train of 5 action potentials at 5 Hz. Inset shows superimposed fEPSPs corresponding to each stimulus. B, summary data of the [Zn2+]t and fEPSP for each action potential within the stimulation train. Both [Zn2+]t and fEPSP were normalized to the value obtained with the 5th stimulus, respectively. C, summary plot of [Zn2+]tversus fEPSP for each action potential, indicating a linear correlation between [Zn2+]t and glutamate release.

Similar articles

Cited by

References

    1. Assaf SY, Chung SH. Release of endogenous Zn2+ from brain tissue during activity. Nature. 1984;308:734–736. - PubMed
    1. Atar D, Backx PH, Appel MM, Gao WD, Marban E. Excitation-transcription coupling mediated by zinc influx through voltage-dependent calcium channels. J Biol Chem. 1995;270:2473–2477. - PubMed
    1. Baron A, Schaefer L, Lingueglia E, Champigny G, Lazdunski M. Zn2+ and H+ are coactivators of acid-sensing ion channels. J Biol Chem. 2001;276:35361–35367. - PubMed
    1. Betz WJ, Bewick GS. Optical analysis of synaptic vesicle recycling at the frog neuromuscular junction. Science. 1992;255:200–203. - PubMed
    1. Buhl EH, Otis TS, Mody I. Zinc-induced collapse of augmented inhibition by GABA in a temporal lobe epilepsy model. Science. 1996;271:369–373. - PubMed

Publication types

LinkOut - more resources