. 2005 Jun;54(6):1706-16.
doi: 10.2337/diabetes.54.6.1706.

The link between nutritional status and insulin sensitivity is dependent on the adipocyte-specific peroxisome proliferator-activated receptor-gamma2 isoform

Affiliations

The link between nutritional status and insulin sensitivity is dependent on the adipocyte-specific peroxisome proliferator-activated receptor-gamma2 isoform

Gema Medina-Gomez et al. Diabetes. 2005 Jun.

Abstract

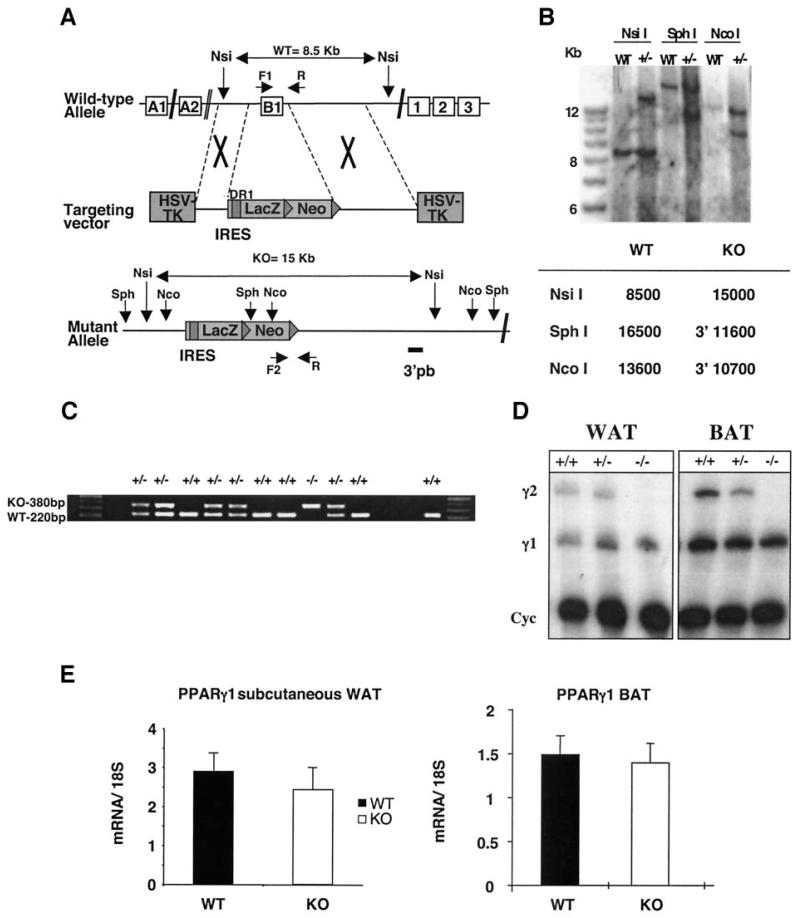
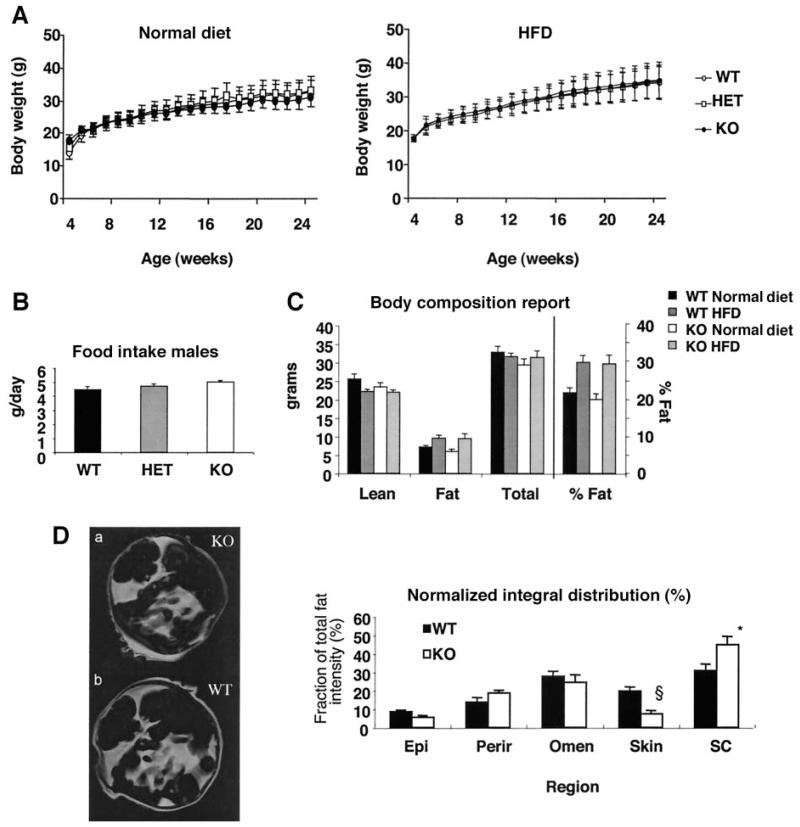
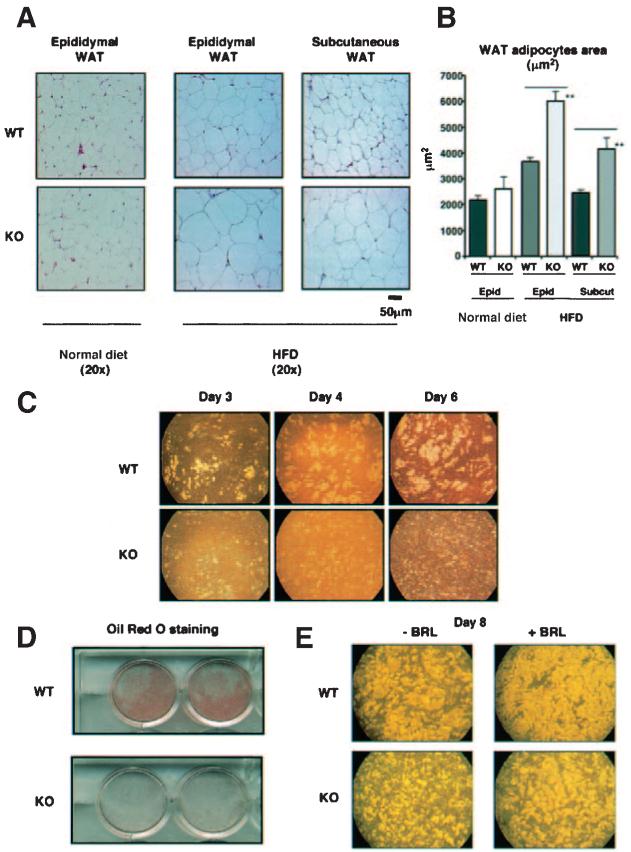
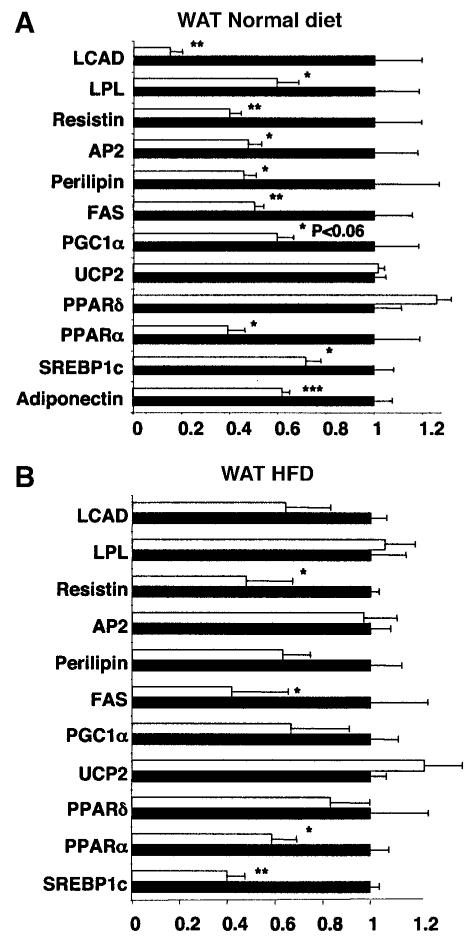
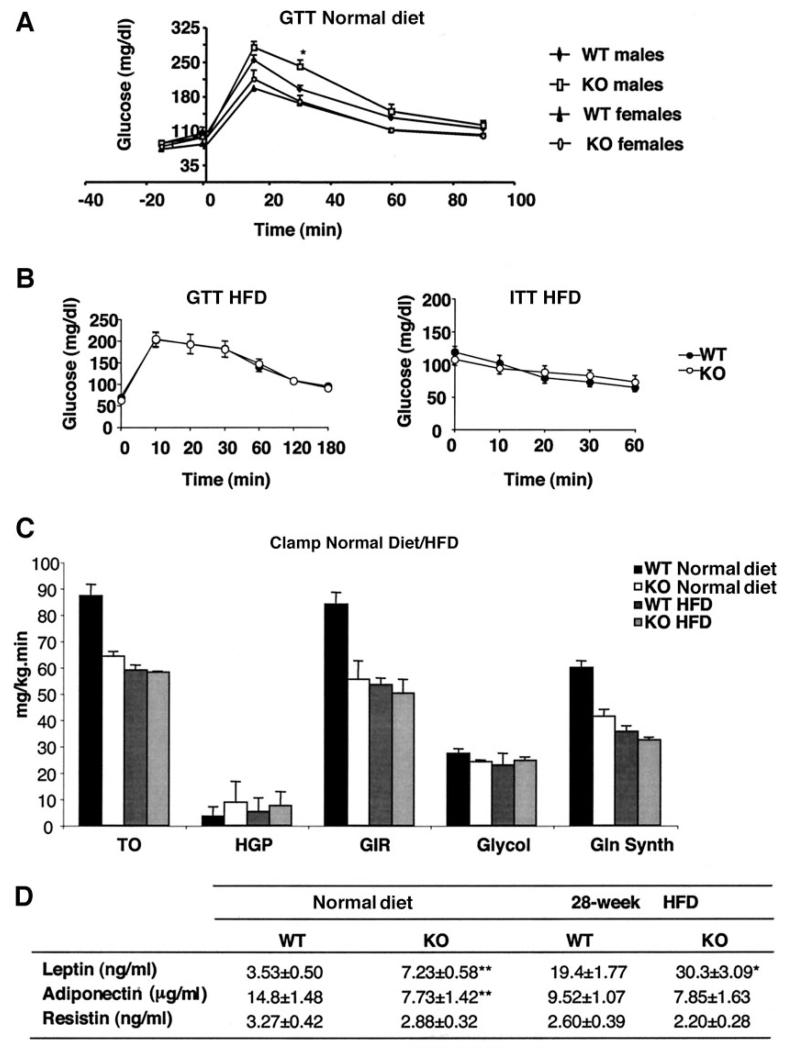
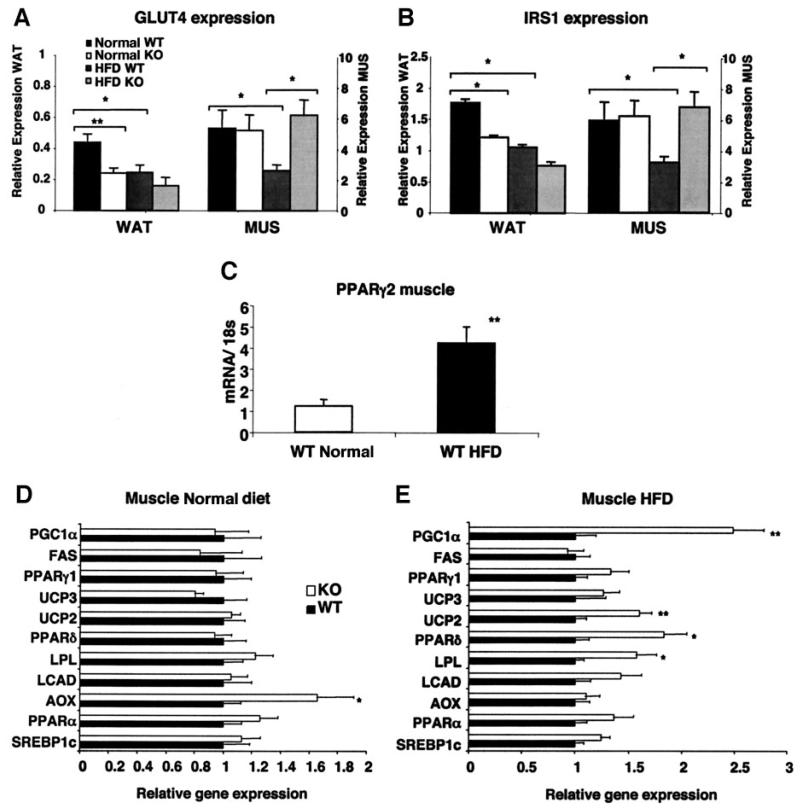
The nuclear receptor peroxisome proliferator-activated receptor-gamma (PPARgamma) is critically required for adipogenesis. PPARgamma exists as two isoforms, gamma1 and gamma2. PPARgamma2 is the more potent adipogenic isoform in vitro and is normally restricted to adipose tissues, where it is regulated more by nutritional state than PPARgamma1. To elucidate the relevance of the PPARgamma2 in vivo, we generated a mouse model in which the PPARgamma2 isoform was specifically disrupted. Despite similar weight, body composition, food intake, energy expenditure, and adipose tissue morphology, male mice lacking the gamma2 isoform were more insulin resistant than wild-type animals when fed a regular diet. These results indicate that insulin resistance associated with ablation of PPARgamma2 is not the result of lipodystrophy and suggests a specific role for PPARgamma2 in maintaining insulin sensitivity independently of its effects on adipogenesis. Furthermore, PPARgamma2 knockout mice fed a high-fat diet did not become more insulin resistant than those on a normal diet, despite a marked increase in their mean adipocyte cell size. These findings suggest that PPARgamma2 is required for the maintenance of normal insulin sensitivity in mice but also raises the intriguing notion that PPARgamma2 may be necessary for the adverse effects of a high-fat diet on carbohydrate metabolism.


Figures

FIG. 1
FIG. 1
Generation of PPARγ2 knockout mouse. A: Schematic representation of PPARγ2 knockout targeting construct and the predicted structure of the recombinant allele. The targeting construct contains 5.2 kb of homologous mouse PPARγ2 genomic DNA, with LacZ/NEO cassette of 5.335 kb. The LacZ/NEO cassette replaces ~164 bp of the PPARγ locus including all 145 bp of exon B1. B: Southern blot analysis of genomic DNA. The 3′ probe (3′pb) is located outside the targeting construct sequence. Genomic DNA was digested with NsiI, SphI, and NcoI. C: Genotyping was performed by multiplex PCR in the same reaction. Specific primers used to detect the knockout (KO) allele were the sense Asc 306 (F2), located in the NEO cassette and PPAR antisense (R) located 42 bp downstream of exon B1 (380-bp PCR product). Primers used to detect the wild-type (WT) allele were the PPAR sense (F1) located 7 bp upstream of exon B1 and PPAR antisense (R) (220-bp PCR product). The binding site for primer F1 was deleted by homologous recombination. D: RPA analysis of PPARγ1 and PPARγ2 in wild-type, heterozygous, and PPARγ2 knockout mice using total RNA from WAT and BAT. Cyc, cyclophilin. E: TaqMan analysis of PPARγ1 in wild-type and PPARγ2 knockout mouse subcutaneous WAT and interscapular BAT.
FIG. 2
FIG. 2
Physiological characterization of PPARγ2 knockout mouse. A: Body weights of males (○, wild type; □, heterozygous; •, PPARγ2 knockout; n = 20) fed a normal diet (left) or an HFD (right). B: Food intake from 20-week normal diet–fed mice (n = 7). C: Body composition analysis from 32-week-old male wild-type and PPARγ2 knockout mice fed a normal diet and a 28-week HFD (n = 5). D: Fat-selective MRI from 32-week-old male PPARγ2 knockout (a) and wild-type (b) mice (n = 5). Regions of interest (epididymal WAT [Epi], perirenal WAT [Perir], omental WAT [oMen], skin, subcutaneous WAT [SC]) were delineated in each fat-selective image, and their total signal intensity was calculated by summing the data from each slice. The results are expressed as a percentage of each fat region from total fat. KO, knockout; WT, wild type. *P < 0.05; §P < 0.01.
FIG. 3
FIG. 3
Characterization of the WAT of PPARγ2 knockout mice. A: Representative histological appearance of hematoxylin-eosin–stained sections from epididymal WAT, from male wild-type and PPARγ2 knockout mice fed a normal diet (n = 7), and from epididymal and subcutaneous WAT depots from mice fed a 16-week HFD (n = 5). B: Area of epididymal and subcutaneous WAT adipocytes (200 random adipocytes) from wild-type and PPARγ2 knockout mice fed a normal diet and an HFD (n = 5). **P < 0.01 (Kruskal-Wallis test). C: Time course of WAT preadipocyte differentiation from wild-type and PPARγ2 knockout mice. Cells were observed by light microscopy after 3, 4, and 6 days of differentiation with standard differentiation-induction medium (representative experiment of three). D: Oil Red O staining of WAT adipocytes after 8 days of differentiation from wild-type and PPARγ2 knockout mice. E: 8 days of differentiation of WAT preadipocytes from wild-type and PPARγ2 knockout mice with and without BRL treatment.
FIG. 4
FIG. 4
Gene expression analysis of PPARγ2-deficient WAT. Adipose tissue mRNA levels determined by real-time PCR of different genes from 16-week-old male wild-type (■) and PPARγ2 knockout (□) mice fed a normal diet (A) and an HFD (B). All wild-type values normalized to one for each gene (n = 5–7). *P < 0.05; **P < 0.01.
FIG. 5
FIG. 5
Lipidomic analyses in WAT of PPARγ2 knockout mice. Histogram showing the distribution of up-/downregulated processed peaks from LC/MS corresponding to lipid compounds. Height of each bar corresponds to number of peaks within a particular range of ratios of means (knockout [KO] vs. wild type [WT]).
FIG. 6
FIG. 6
Effect of PPARγ2 deletion on insulin sensitivity. A: Plasma glucose levels during GTT in 16-week-old male and female mice fed a normal diet (n = 7). *P < 0.05 vs. wild type. B: Plasma glucose levels during GTT and ITT in male wild-type (•) and PPARγ2 knockout (○) mice fed 28 weeks of an HFD. C: Whole-body metabolic parameters during the euglycemic-hyperinsulinemic clamp experiment. Glucose turnover (TO), hepatic glucose production (HGP), glucose infusion rate (GIR), glycolysis (Glycol), and glycogen synthesis (Gln synth). Rates were obtained from male mice fed a normal diet (normal diet, n = 7) and an 28-week HFD (n = 6). D: Plasma adipokines levels from 32-week-old male wild-type and PPARγ2 knockout mice fed a normal diet and an HFD. KO, knockout; WT, wild type.
FIG. 7
FIG. 7
Gene expression analysis of PPARγ2-deficient skeletal muscle. Glut4 (A) and IRS-1 (B) mRNA levels in WAT and muscle from 16-week-old male wild-type (WT) and PPARγ2 knockout (KO) mice fed a normal diet and an HFD (n = 5–8). C: PPARγ2 mRNA levels in muscle of 16-week-old wild-type mice fed a normal diet and an HFD (n = 5–7). Skeletal muscle mRNA levels from different genes from 16-week-old male wild-type and PPARγ2 knockout mice fed a normal diet (D) and an HFD (E) (n = 5–7). *P < 0.05; **P < 0.01.

References

    1. Escher P, Braissant O, Basu-Modak S, Michalik L, Wahli W, Desvergne B. Rat PPARs: quantitative analysis in adult rat tissues and regulation in fasting and refeeding. Endocrinology. 2001;142:4195–4202. - PubMed
    1. Werman A, Hollenberg A, Solanes G, Bjorbaek C, Vidal-Puig AJ, Flier JS. Ligand-independent activation domain in the N terminus of peroxisome proliferator-activated receptor γ (PPARγ): differential activity of PPARγ1 and -2 isoforms and influence of insulin. J Biol Chem. 1997;272:20230–20235. - PubMed
    1. Ren D, Collingwood TN, Rebar EJ, Wolffe AP, Camp HS. PPARγ knockdown by engineered transcription factors: exogenous PPARγ2 but not PPARγ1 reactivates adipogenesis. Genes Dev. 2002;16:27–32. - PMC - PubMed
    1. Altshuler D, Hirschhorn JN, Klannemark M, Lindgren CM, Vohl MC, Nemesh J, Lane CR, Schaffner SF, Bolk S, Brewer C, Tuomi T, Gaudet D, Hudson TJ, Daly M, Groop L, Lander ES. The common PPARγ Pro12Alapolymorphism is associated with decreased risk of type 2 diabetes. Nat Genet. 2000;26:76–80. - PubMed
    1. Vidal-Puig A, Jimenez-Linan M, Lowell BB, Hamann A, Hu E, Spiegelman B, Flier JS, Moller DE. Regulation of PPAR γ gene expression by nutrition and obesity in rodents. J Clin Invest. 1996;97:2553–2561. - PMC - PubMed

Publication types