. 2005 Jun 7;102(23):8263-8.
doi: 10.1073/pnas.0502155102. Epub 2005 May 26.

Hamilton's indicators of the force of selection

Affiliations

Hamilton's indicators of the force of selection

Annette Baudisch. Proc Natl Acad Sci U S A. .

Abstract

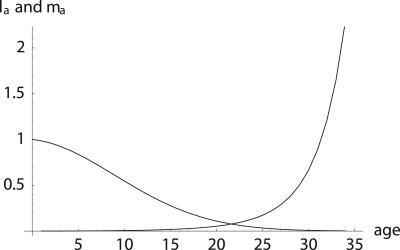
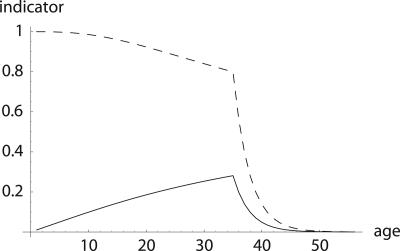
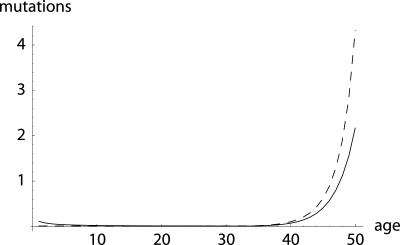
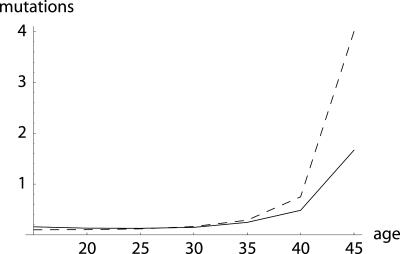
To quantify the force of selection, Hamilton [Hamilton, W. D. (1966) J. Theor. Biol. 12, 12-45] derived expressions for the change in fitness with respect to age-specific mutations. Hamilton's indicators are decreasing functions of age. He concluded that senescence is inevitable: survival and fertility decline with age. I show that alternative parameterizations of mutational effects lead to indicators that can increase with age. I then consider the case of deleterious mutations with age-specific effects. In this case, it is the balance between mutation and selection pressure that determines the equilibrium number of mutations in a population. In this balance, the effects of different parameterizations cancel out, but only to a linear approximation. I show that mutation accumulation has little impact at ages when this linear approximation holds. When mutation accumulation matters, nonlinear effects become important, and the parameterizations of mutational effects make a difference. The results also suggest that mutation accumulation may be relatively unimportant over most of the reproductive lifespan of any species.


Figures

Fig. 1.
Fig. 1.
Example of survival and maternity functions la and ma. If age-specific survival probabilities pa change according to formula image with p0 < 1, then the average force of mortality between age a and a + 1 is given by formula image. Maternity ma+1 was chosen to be 0.01 units smaller than the left-hand side of the inequality in Eq. 8, setting r = 0, p0 = 0.99 and m0 = 0. By age 34, survival falls to 0.25%. After age 34, I fixed age-specific survival pa at its level of p35 = 0.70 corresponding to formula image and adjusted ma to a constant level of 133.265 such that Eq. 1 is fulfilled.
Fig. 2.
Fig. 2.
Comparison of H = dr/d ln pa (dashed line) with dr/d ln formula image (solid line). While Hamilton's indicator H declines, the alternative one increases until age 34. The increase would have continued if ma+1 was further determined by the inequality in Eq. 8. This, however, would result in a trajectory for ma that would rise to enormous heights. Also note that Hamilton's indicator is greater than the alternative indicator, especially before age 35. This implies a considerably stronger force of selection on age-specific mutations that affect mortality.
Fig. 3.
Fig. 3.
Equilibrium number of mutations: additive (dashed line) and proportional (solid line). I assume that mutation pressure ν = 0.001. Furthermore, I assume that a mutation at any age reduces remaining reproduction by ≈10% in both the additive and proportional cases. This refers to an average reduction in the proportional case, because Δ(n) depends on the level of mortality at age a, as can be seen from Eq. 21b. Specifically, δ = 0.1 in Eq. 21a and δ = 0.35 in Eq. 21b. Although in the Hamiltonian case of an additive hazard, the number of mutations remains low and then increases with age, proportional effects lead to an age-specific mutational load that declines at young ages. In the example, only one-quarter of 1% of individuals are alive at age 34. Before this age, the mutational load is close to zero. After this age, however, the equilibrium number of mutations sharply rises.
Fig. 4.
Fig. 4.
Equilibrium number of mutations: additive (dashed line) and proportional (solid line). The example is based on female mortality, as given in the Swedish life table for 1778–1782, for seven 5-year age groups, beginning at age 15. Because the Swedish population was growing at that time, I normalized reproduction to ensure R = 1.00. I consider a deleterious mutation that reduces remaining reproduction at any age by ≈1%, either in an additive or in a proportional way, i.e., δ = 0.01 in Eq. 21a and δ = 0.7 in Eq. 21b, and I assume a mutation pressure of ν = 0.001. The difference between the additive and proportional case increases at higher ages, as levels of remaining reproduction decline. A slight decrease in the equilibrium number of mutations from the first to the second age group can be observed.
Fig. 5.
Fig. 5.
Mortality: additive (dashed line), proportional (solid line), and initial mortality μa(0) (dotted line). Initial mortality is from the Swedish life table for 1778–1782, females, for seven 5-year age groups, beginning at age 15.
Fig. 6.
Fig. 6.
Proportion of mortality explained by mutation accumulation: additive (dashed line) vs. the proportional (solid line) case. The fraction 1 - μa(0)/μa() indicates the proportion of equilibrium mortality that can be explained by the accumulation of mutations. For the example of Swedish females, when ν = 0.001, over the main span of reproductive life mutation accumulation explains less than one-third of total mortality. Note, however, that at ages 45–50, when mortality is high, mutation accumulation accounts for the bulk of total mortality.

References

    1. Hamilton, W. D. (1966) J. Theor. Biol. 12, 12-45. - PubMed
    1. Hamilton, W. D. (1996) Narrow Roads of Gene Land: The Collected Papers of W. D. Hamilton (Freeman, New York), Vol. 1.
    1. Medawar, P. (1952) An Unsolved Problem of Biology (Lewis, London).
    1. Williams, G. C. (1957) Evolution (Lawrence, Kans.) 11, 398-411.
    1. Lotka, A. J. (1924) Elements of Mathematical Biology; reprinted (1956) (Dover, New York).