. 2005 Jun;166(6):1871-81.
doi: 10.1016/S0002-9440(10)62496-0.

Anthrax lethal toxin induces endothelial barrier dysfunction

Affiliations

Anthrax lethal toxin induces endothelial barrier dysfunction

Jason M Warfel et al. Am J Pathol. 2005 Jun.

Abstract

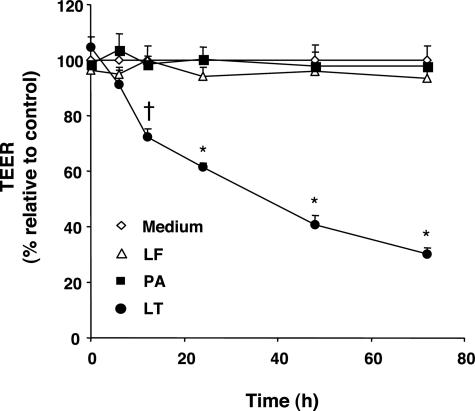
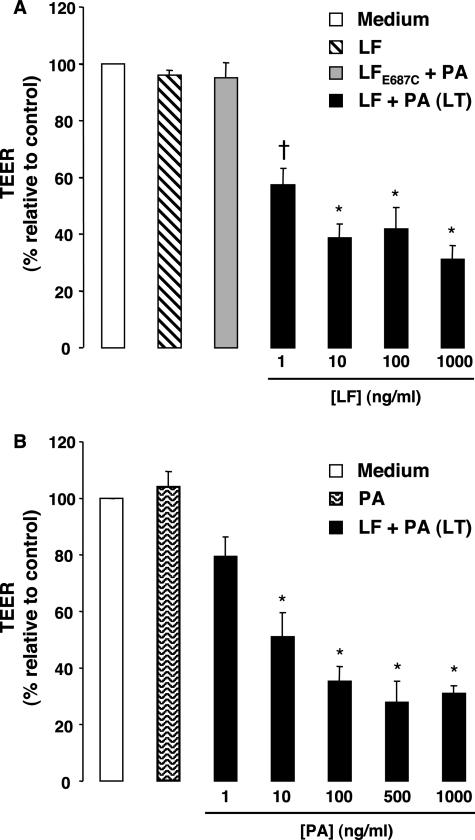
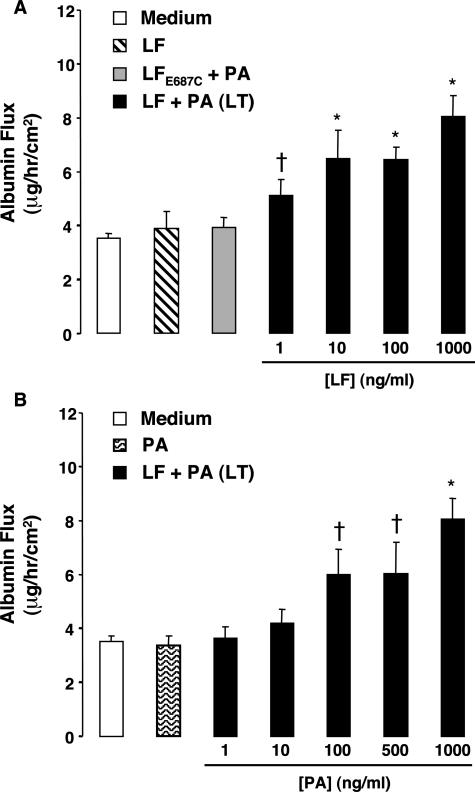
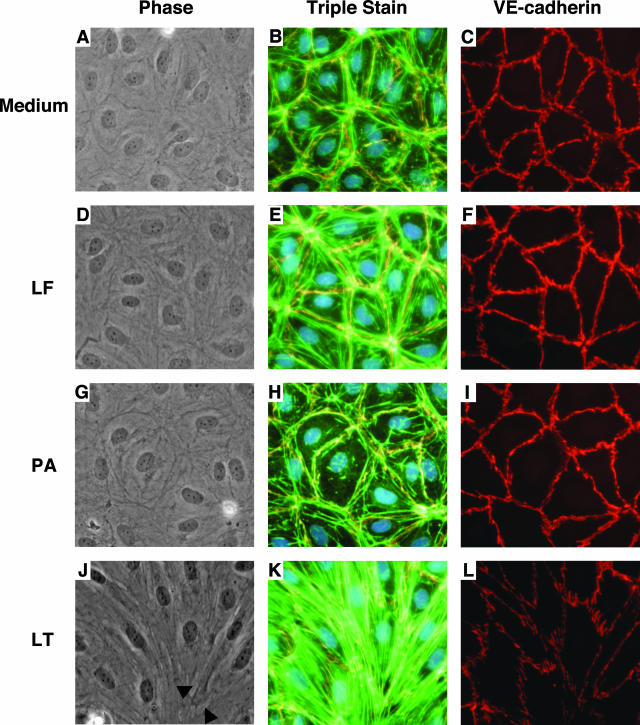
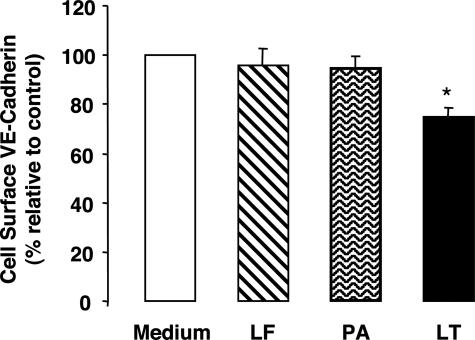
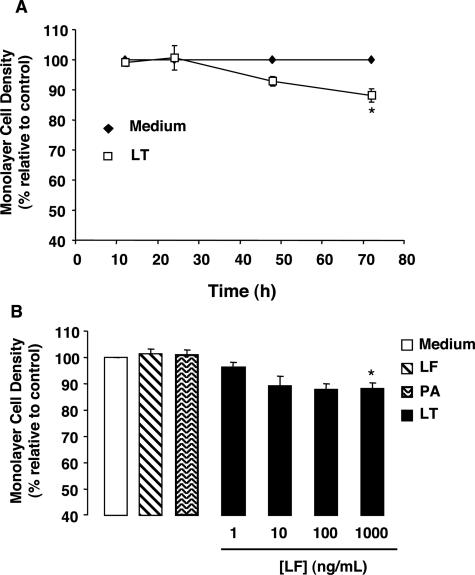
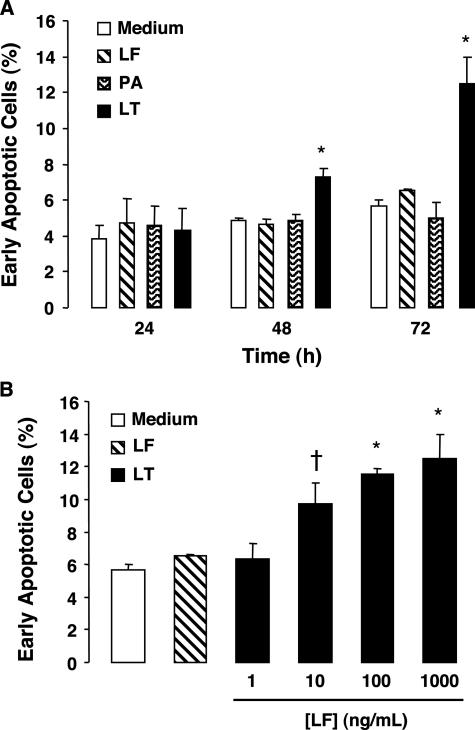
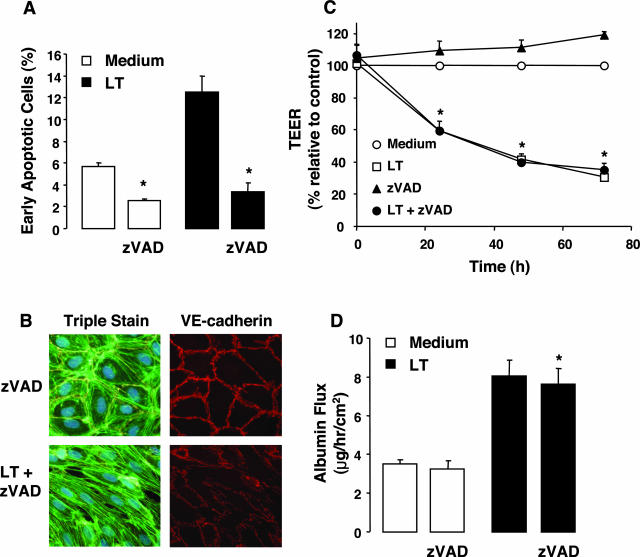
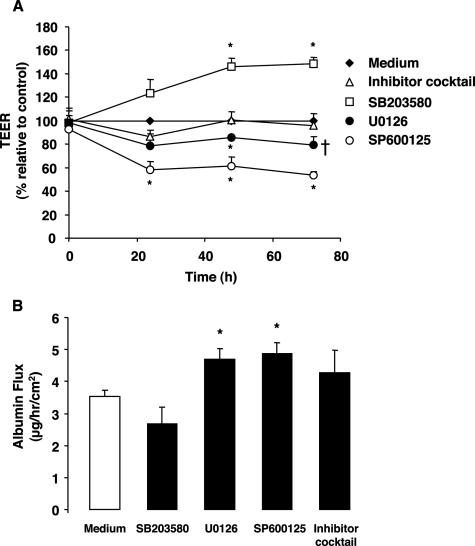
Hemorrhage and pleural effusion are prominent pathological features of systemic anthrax infection. We examined the effect of anthrax lethal toxin (LT), a major virulence factor of Bacillus anthracis, on the barrier function of primary human lung microvascular endothelial cells. We also examined the distribution patterns of cytoskeletal actin and vascular endothelial-cadherin (VE-cadherin), both of which are involved in barrier function regulation. Endothelial monolayers cultured on porous membrane inserts were treated with the LT components lethal factor (LF) and protective antigen (PA) individually, or in combination. LT induced a concentration- and time-dependent decrease in transendothelial electrical resistance that correlated with increased permeability to fluorescently labeled albumin. LT also produced a marked increase in central actin stress fibers and significantly altered VE-cadherin distribution as revealed by immunofluorescence microscopy and cell surface enzyme-linked immunosorbent assay. Treatment with LF, PA, or the combination of an inactive LF mutant and PA did not alter barrier function or the distribution of actin or VE-cadherin. LT-induced barrier dysfunction was not dependent on endothelial apoptosis or necrosis. The present findings support a possible role for LT-induced barrier dysfunction in the vascular permeability changes accompanying systemic anthrax infection.


Figures

Figure 1
Figure 1
LT induces time-dependent reduction in TEER. Monolayers grown on porous membrane inserts were incubated with medium alone or medium containing 1 μg/ml LF, 1 μg/ml PA, or both (LT). At the indicated time points, TEER readings were obtained as described in Materials and Methods. Values were reported as the percentage of basal TEER obtained by dividing the resistance values of each treated monolayer by the resistance value of the control monolayer at each given time point. The means ± SE for a minimum of three independent experiments are shown (n = 3–8). *P < 0.001, P < 0.05 versus medium alone.
Figure 2
Figure 2
Concentration-dependent effects of LT on TEER. A: Monolayers grown on porous membrane inserts were incubated with medium alone or medium containing 1 μg/ml LF, 1 μg/ml LFE687C and PA, or varying amounts of LF in the presence of 1 μg/ml PA. TEER readings were obtained after 72 hours and reported as the means ± SE for a minimum of three independent experiments. *P < 0.001, P < 0.01 versus medium alone. B: Monolayers were treated with medium alone, medium containing 1 μg/ml PA, or varying amounts of PA in the presence of 1 μg/ml LF. TEER readings were obtained after 72 hours and reported as the means ± SE for a minimum of three independent experiments. *P < 0.001 versus medium alone.
Figure 3
Figure 3
Concentration-dependent effects of LT on albumin permeability. A: Monolayers were grown and treated as in Figure 2A. After 72 hours, FITC-HSA was added to the upper compartment of the insert. After 2 hours, the amount of FITC-HSA in the bottom compartment was measured using a fluorescent microplate reader. Values were calculated as the micrograms of FITC-HSA per hour per square centimeter and reported as the means ± SE for a minimum of three independent experiments. *P < 0.001, P < 0.01 versus medium alone. B: Monolayers were grown and treated as in Figure 2B. Data were collected as in Figure 3A and reported as the means ± SE for a minimum of three independent experiments. *P < 0.001, P < 0.01 versus medium alone.
Figure 4
Figure 4
Phase contrast morphology and immunofluorescence visualization of F-actin, VE-cadherin, and nuclei. Cells were incubated with medium alone (A to C) or medium containing 1 μg/ml LF (D to F), 1 μg/ml PA (G to I), or both (J to L). After 72 hours, monolayers were washed, fixed, and stained with Hoechst 33342 (blue), F-actin (green), and VE-cadherin (red) as described in Materials and Methods. Phase contrast images and corresponding immunofluorescence images were visualized using an inverted microscope (40× objective). LT induced cellular elongation and small interendothelial gaps (black arrows) compared with medium, LF, or PA alone. In addition, LT increased central F-actin stress fibers and decreased VE-cadherin immunofluorescence. Images are representative of five separate experiments. Note that in the triple-stained photomicrographs, the VE-cadherin immunofluorescence was masked by the bright F-actin staining.
Figure 5
Figure 5
LT decreases cell surface VE-cadherin. Cells were incubated with medium alone or medium containing 1 μg/ml LF, 1 μg/ml PA, or both. After 72 hours, monolayers were washed and fixed in 1% paraformaldehyde. A cell-based ELISA was performed as described in Materials and Methods. Cell surface VE-cadherin was measured as the absorbance at 450 nm. Values were calculated as the percent relative to control and are shown as the means ± SE for a minimum of three independent experiments (n = 3–4). *P < 0.001 versus medium alone.
Figure 6
Figure 6
Effect of LT on monolayer cell density. A: Confluent cultures in 12- or 24-well dishes were treated with medium alone or medium containing 1 μg/ml LF and 1 μg/ml PA. At the indicated time points, monolayers were stained with Hoechst 33342 and PI. For each treatment, immunofluorescence images of five separate fields were visualized using an inverted microscope (20× objective). For each image, adherent cells with normal nuclear morphology excluding apoptotic and necrotic cells were identified and counted, and the average was tabulated for each well. Monolayer cell density was calculated as the percentage of normal adherent nuclei relative to untreated control wells, and values are reported as the mean ± SE for a minimum of three independent experiments (n = 3 - 6). *P < 0.05 versus medium alone. B: After 72 hours, monolayer cell density was analyzed after treatment with medium alone, 1 μg/ml LF, 1 μg/ml PA, or varying amounts of LF and 1 μg/ml PA. *P < 0.05 versus medium alone (n = 3–6).
Figure 7
Figure 7
Effect of LT on endothelial apoptosis. A: Cells were incubated with medium alone or medium containing 1 μg/ml LF, 1 μg/ml PA, or both (LT). At the indicated time points, PS externalization was measured as described in Materials and Methods. The percentage of early apoptotic cells (annexin V+, PI−) is shown as the means ± SE for a minimum of three independent experiments (n = 3–5). *P < 0.01 versus medium alone. B: Cells were treated with medium alone, 1 μg/ml LF, or varying amounts of LF in the presence of 1 μg/ml PA. After 72 hours, adherent and nonadherent cells were pooled and analyzed for PS externalization. The percentage of early apoptotic cells (annexin V+, PI−) is shown as the means ± SE for a minimum of three independent experiments (n = 3–5). *P < 0.01, P < 0.05 versus medium alone.
Figure 8
Figure 8
Effect of caspase inhibition on LT-mediated apoptosis and barrier dysfunction. Cells were treated with the general caspase inhibitor, zVAD (80 μmol/L), 1 hour before the addition of 1 μg/ml each of LF and PA. A: After 72 hours, adherent and nonadherent cells were pooled and analyzed for PS externalization as described in Materials and Methods. The percentage of early apoptotic cells (annexin V+, PI-) is shown as the means ± SE for a minimum of three independent experiments (n = 3–5). *P < 0.01 versus medium alone or LT. There was no significant difference between the two zVAD treatment groups. B: After 72 hours, monolayers were washed, fixed, and stained with Hoechst 33342 (blue), F-actin (green), and VE-cadherin (red) as described in Materials and Methods. Immunofluorescence images were visualized as described in Figure 4. C: TEER readings were obtained at 0, 24, 48, and 72 hours. Values were reported as the percentage of basal TEER obtained by dividing the resistance values of each treated monolayer by the resistance value of the control monolayer at each given time point. The means ± SE for a minimum of three independent experiments are shown. *P < 0.01, LT + zVAD versus zVAD alone. D: After 72 hours, the permeability of monolayers to FITC-HSA was measured. Values were calculated as the micrograms of FITC-HSA per hour per square centimeter and reported as the means ± SE for a minimum of three independent experiments. *P < 0.01 versus zVAD alone.
Figure 9
Figure 9
Effect of MEK and MAP kinase inhibitors on barrier function. Cells were treated with 10 μmol/L U0126 (MEK1/2 inhibitor), 10 μmol/L SP600125 (JNK inhibitor), or 20 μmol/L SB203580 (p38 inhibitor) individually or with the inhibitor cocktail (the combination of all three inhibitors). A: TEER readings were measured at the indicated time intervals and reported as the means ± SE for a minimum of three independent experiments. *P < 0.01, P < 0.05 versus medium alone. B: Monolayer permeability to FITC-HSA after 72 hours. Values were calculated as the micrograms of FITC-HSA per hour per square centimeter and reported as the means ± SE for a minimum of three independent experiments. *P < 0.05 versus medium alone.

Similar articles

Cited by

References

    1. Leppla SH. The bifactorial Bacillus anthracis lethal and oedema toxins. Alouf JA, Freer J, editors. London: Academic Press,; Comprehensive Sourcebook of Bacterial Protein Toxins. 1999:pp 243–263.
    1. Moayeri M, Leppla SH. The roles of anthrax toxin in pathogenesis. Curr Opin Microbiol. 2004;7:19–24. - PubMed
    1. Mock M, Fouet A. Anthrax. Annu Rev Microbiol. 2001;55:647–671. - PubMed
    1. Bradley KA, Mogridge J, Mourez M, Collier RJ, Young JA. Identification of the cellular receptor for anthrax toxin. Nature. 2001;414:225–229. - PubMed
    1. Scobie HM, Rainey GJ, Bradley KA, Young JA. Human capillary morphogenesis protein 2 functions as an anthrax toxin receptor. Proc Natl Acad Sci USA. 2003;100:5170–5174. - PMC - PubMed

Publication types

MeSH terms

LinkOut - more resources