. 2005 Jun 15;24(12):2214-23.
doi: 10.1038/sj.emboj.7600698. Epub 2005 May 26.

Opposing roles for DNA structure-specific proteins Rad1, Msh2, Msh3, and Sgs1 in yeast gene targeting

Affiliations

Opposing roles for DNA structure-specific proteins Rad1, Msh2, Msh3, and Sgs1 in yeast gene targeting

Lance D Langston et al. EMBO J. .

Abstract

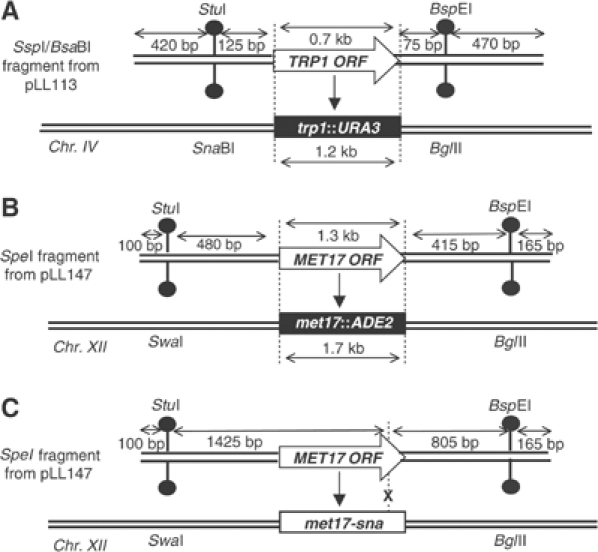
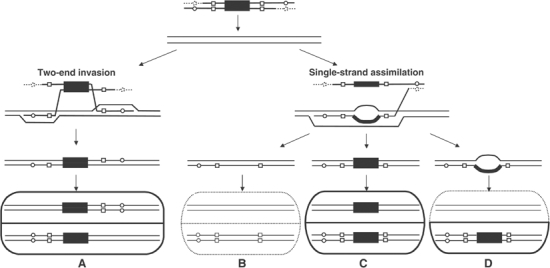
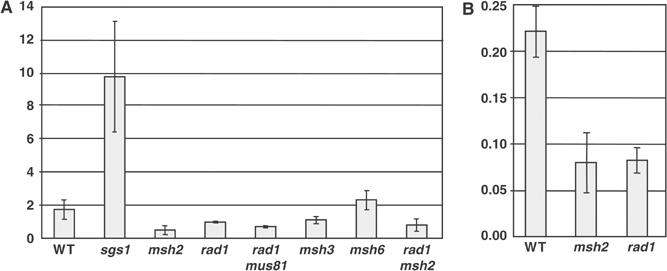
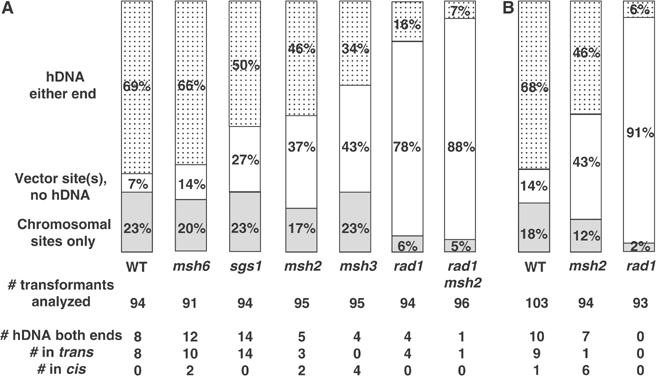
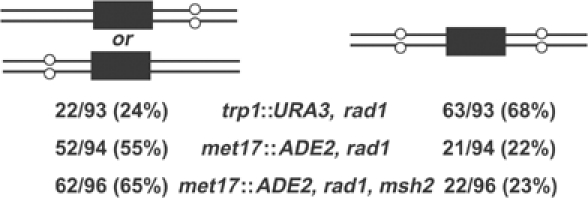
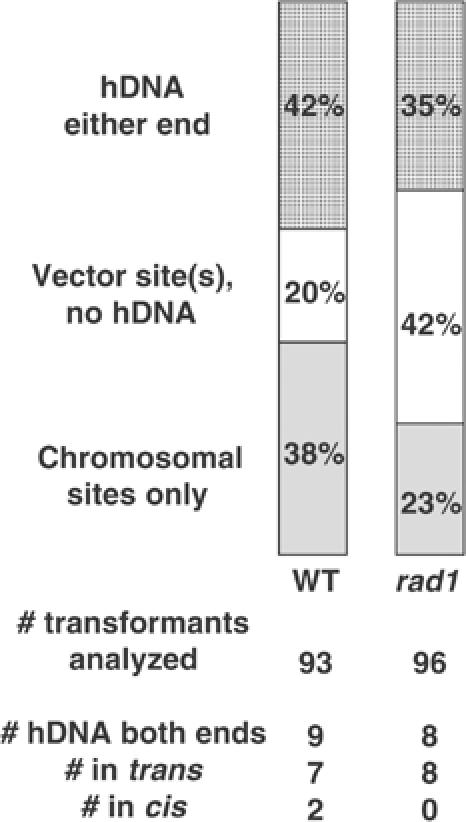
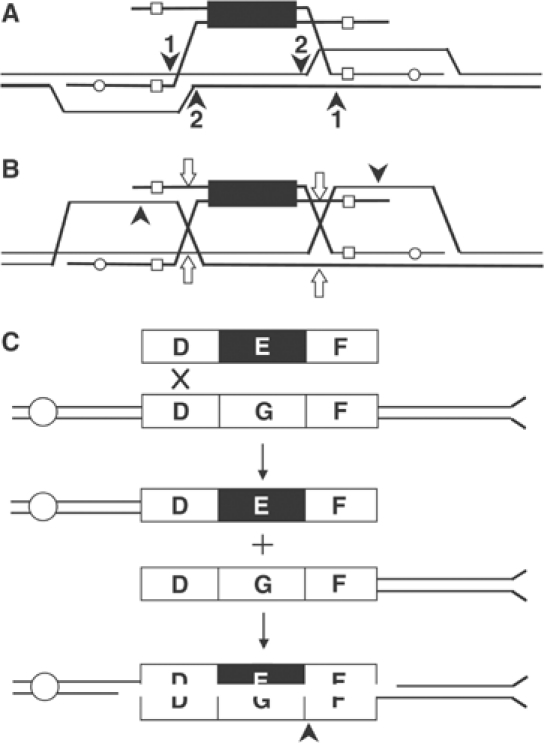
Targeted gene replacement (TGR) in yeast and mammalian cells is initiated by the two free ends of the linear targeting molecule, which invade their respective homologous sequences in the chromosome, leading to replacement of the targeted locus with a selectable gene from the targeting DNA. To study the postinvasion steps in recombination, we examined the effects of DNA structure-specific proteins on TGR frequency and heteroduplex DNA formation. In strains deleted of RAD1, MSH2, or MSH3, we find that the frequency of TGR is reduced and the mechanism of TGR is altered while the reverse is true for deletion of SGS1, suggesting that Rad1 and Msh2:Msh3 facilitate TGR while Sgs1 opposes it. The altered mechanism of TGR in the absence of Msh2:Msh3 and Rad1 reveals a separate role for these proteins in suppressing an alternate gene replacement pathway in which incorporation of both homology regions from a single strand of targeting DNA into heteroduplex with the targeted locus creates a mismatch between the selectable gene on the targeting DNA and the targeted gene in the chromosome.


Figures

Figure 1
Figure 1
Schematics of targeting DNA and targeted yeast strains. Open arrows show the selectable markers, TRP1 or MET17, and rectangles show the corresponding disrupted allele in the chromosome. (A) Targeting at the TRP1 locus. (B) Targeting at the MET17 locus of a complete disruption or (C) a point mutation. Restriction site polymorphisms in the flanking homology regions are indicated. This figure is adapted from Figure 2 of Langston and Symington (2004).
Figure 2
Figure 2
Models of targeted gene replacement. The large black box represents the selectable marker on the targeting DNA; small open boxes and open circles indicate different relative positions of palindromic restriction site inserts in the flanking homology regions of the TRP1 and MET17 targeting DNA, respectively; dotted lines indicate possible nuclease resection of the 5′ ends of the targeting DNA. Uninterrupted lines indicate the targeted chromosomal locus. Bisected ovals at bottom show the different genotypes of the two daughter cells arising from TGR as shown. As indicated by the thick versus dotted lines, only daughter cells containing the targeting marker survive selection to form all or part of a colony. (A) TGR with flanking markers in trans. (B) No TGR. The large bubble mismatch between the selectable marker on the targeting DNA and the targeted chromosomal locus is unwound, or is repaired in favor of chromosomal sequences. (C) TGR with flanking markers in cis. The bubble mismatch is repaired in favor of the targeting DNA. (D) TGR with no hDNA observed. The bubble mismatch is not repaired, and all information from the top, chromosomal strand is lost under selection for the targeting DNA marker on the bottom strand.
Figure 3
Figure 3
Frequency of TGR. Number of TGR events per 100 ng of targeting DNA compared to the number of transformants per 1 ng of uncut control plasmid DNA. (A) Targeting of met17ADE2 in the indicated genetic background. (B) Targeting of trp1URA3. Shown are the means and standard deviations of at least three experiments except for rad1 mus81, which is from two experiments.
Figure 4
Figure 4
hDNA formation during TGR. (Top) For each strain, the percentage of colonies analyzed that had both vector and chromosomal restriction sites at one or both flanking markers is indicated by the dotted bars, those with vector restriction sites only at one or both flanking markers by open bars, and those with only chromosomal restriction sites at both flanking markers by gray bars. The number of colonies analyzed for each strain is indicated below the stacked bars. (Bottom) For each strain, the number of colonies that had both vector and chromosomal restriction sites at both flanking markers is indicated. Subclone analysis determined how many of these were in the trans or cis configurations. (A) Targeting of met17ADE2 in the indicated genetic background. (B) Targeting of trp1URA3. Data for wild type in both (A) and (B) are adapted from Langston and Symington (2004).
Figure 5
Figure 5
Evidence for single-strand assimilation in the rad1 strain. For the indicated strains, the data from the bars marked ‘vector sites, no hDNA' in Figure 3 are analyzed further to show the percentage of colonies that contained the vector restriction site at only one flanking marker (left) or both flanking markers (right).
Figure 6
Figure 6
hDNA formation during TGR at met17-sna locus is unaffected by deletion of RAD1. hDNA formation and subclone analysis, as in Figure 4, for targeting of a chromosomal frameshift mutation, met17-sna (Figure 1C), are presented.
Figure 7
Figure 7
Possible roles for the Rad1:Rad10 nuclease in TGR. (A) Two different positions at the homology/heterology boundary where Rad1:Rad10 could nick the chromosome to facilitate TGR are indicated by arrows labeled 1 and 2. (B) D-loop pairs with noninvading strand; Rad1:Rad10 (black arrows) works in combination with a Holliday junction resolvase (open arrows). (C) One end of targeting DNA integrates into the chromosome in the flanking homology region labeled D, creating two chromosome fragments; 5′-end resection of both fragments reveals homologous sequences at D and F, interrupted by heterologous sequences at E and G; processing by Rad1:Rad10 at the homology/heterology boundary (indicated by an arrow) leads to TGR. For clarity, centromeric and telomeric positions on the targeted chromosome arm are indicated by open circles and flanges, respectively.

References

    1. Bardwell AJ, Bardwell L, Tomkinson AE, Friedberg EC (1994) Specific cleavage of model recombination and repair intermediates by the yeast Rad1–Rad10 DNA endonuclease. Science 265: 2082–2085 - PubMed
    1. Bartsch S, Kang LE, Symington LS (2000) RAD51 is required for the repair of plasmid double-stranded DNA gaps from either plasmid or chromosomal templates. Mol Cell Biol 20: 1194–1205 - PMC - PubMed
    1. Baudin A, Ozier-Kalogeropoulos O, Denouel A, Lacroute F, Cullin C (1993) A simple and efficient method for direct gene deletion in Saccharomyces cerevisiae. Nucleic Acids Res 21: 3329–3330 - PMC - PubMed
    1. Clikeman JA, Wheeler SL, Nickoloff JA (2001) Efficient incorporation of large (>2 kb) heterologies into heteroduplex DNA: Pms1/Msh2-dependent and -independent large loop mismatch repair in Saccharomyces cerevisiae. Genetics 157: 1481–1491 - PMC - PubMed
    1. Constantinou A, Chen XB, McGowan CH, West SC (2002) Holliday junction resolution in human cells: two junction endonucleases with distinct substrate specificities. EMBO J 21: 5577–5585 - PMC - PubMed

Publication types